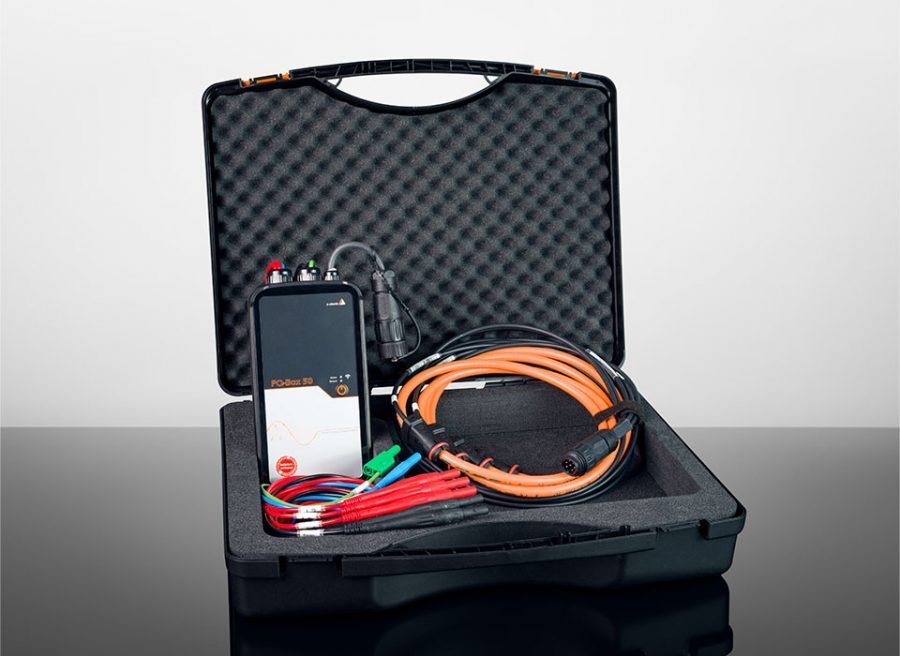
The reliability of any industrial plant‘s power supply is of high importance, because downtime of production is equal to loss of money. Hence, it is important to find disturbances in the system in a fast and reliable way. This report shows an example for trouble shooting with the Power Quality analyzer PQ-Box 50. The measurement took place at a low voltage site (3 phase 230 V line-to-neutral) of an industrial plant.
The plant was suffering from occasionally occurring failures caused by unintended tripping of circuit breakers. A measurement should determine the cause of the tripping of the circuit breakers.
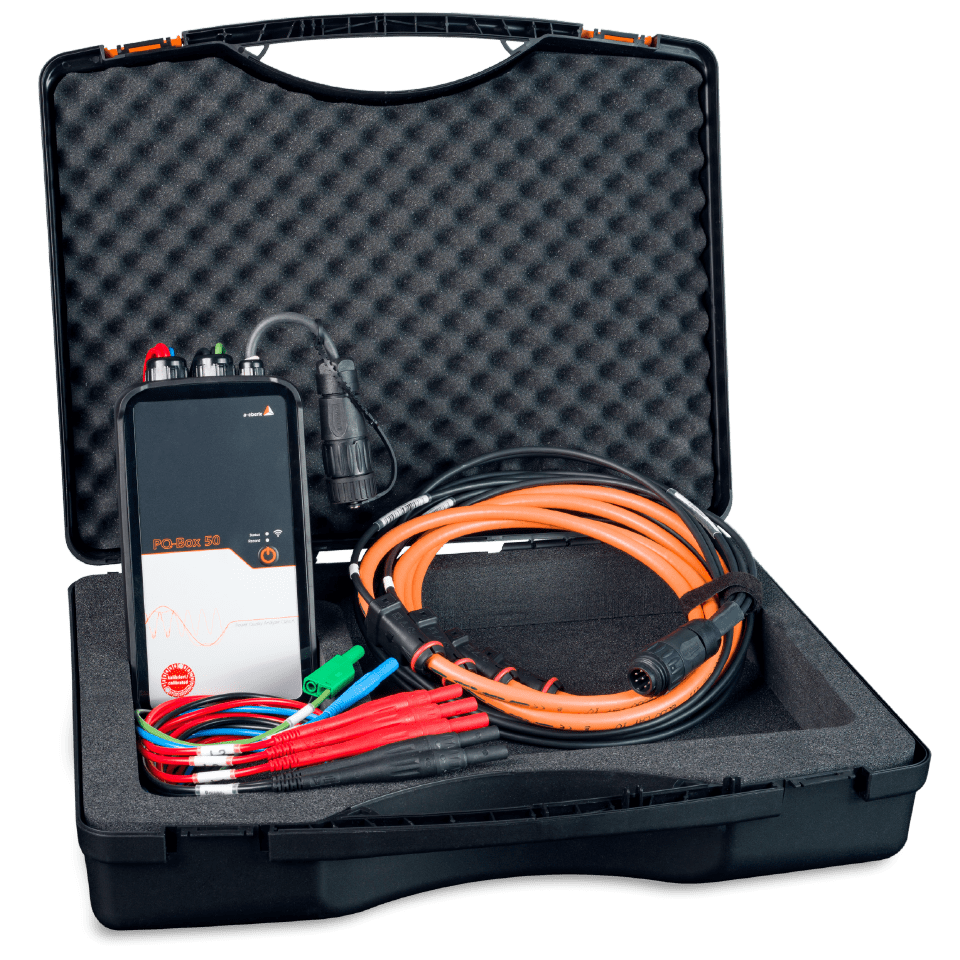
Setup of PQ-Box 50
The WinPQ mobil software provides several templates for parameterization of the devices in industrial environment:
- IEC 61000-2-4 Class 1, 2, 3
- IEC 61000-2-2
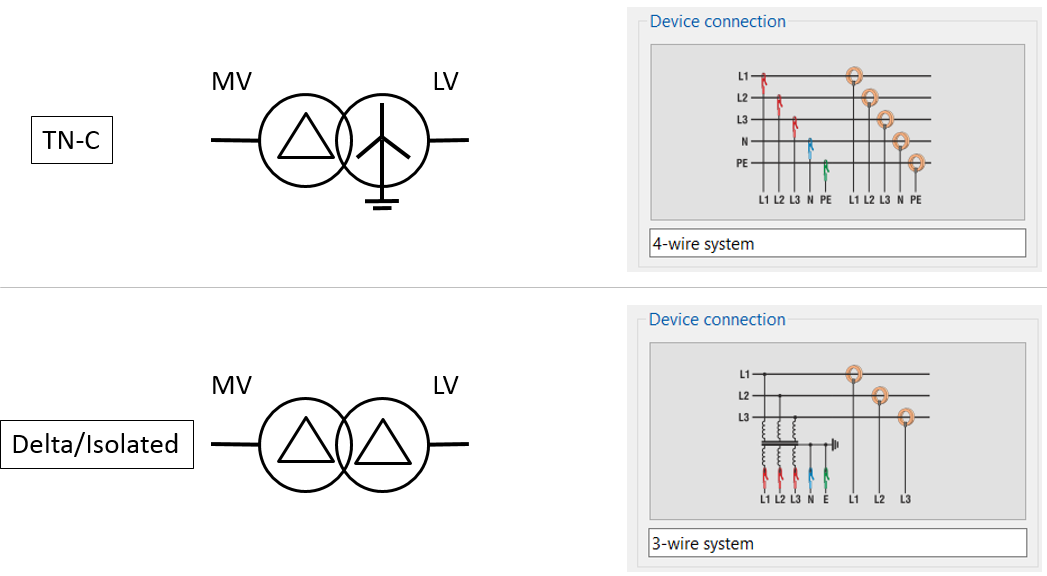
In a low voltage system, the standard grid type is 4-wire (TN-C), but in some special applications, it is possible to face isolated delta systems (IT) as displayed in Figure 1.
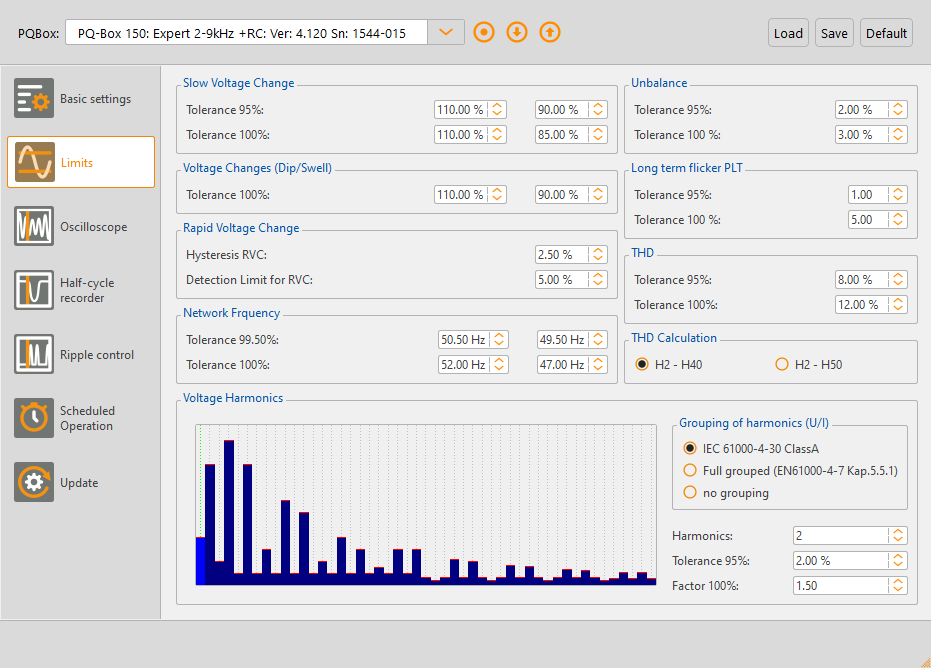
The norm templates provide an overview about thresholds for all relevant power quality parameters like frequency, voltage changes and harmonics. The user is able to adapt all values.
Connection at the measurement point
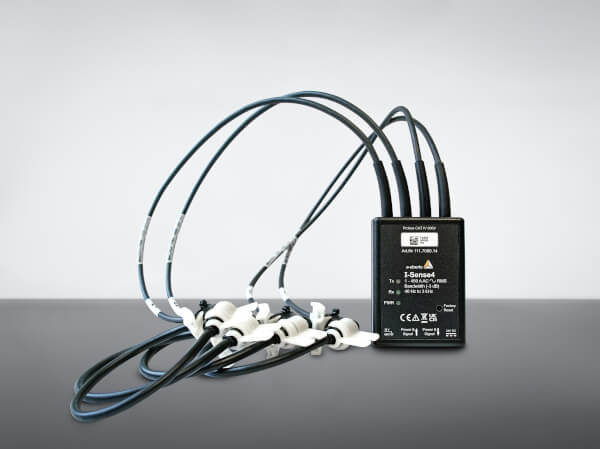
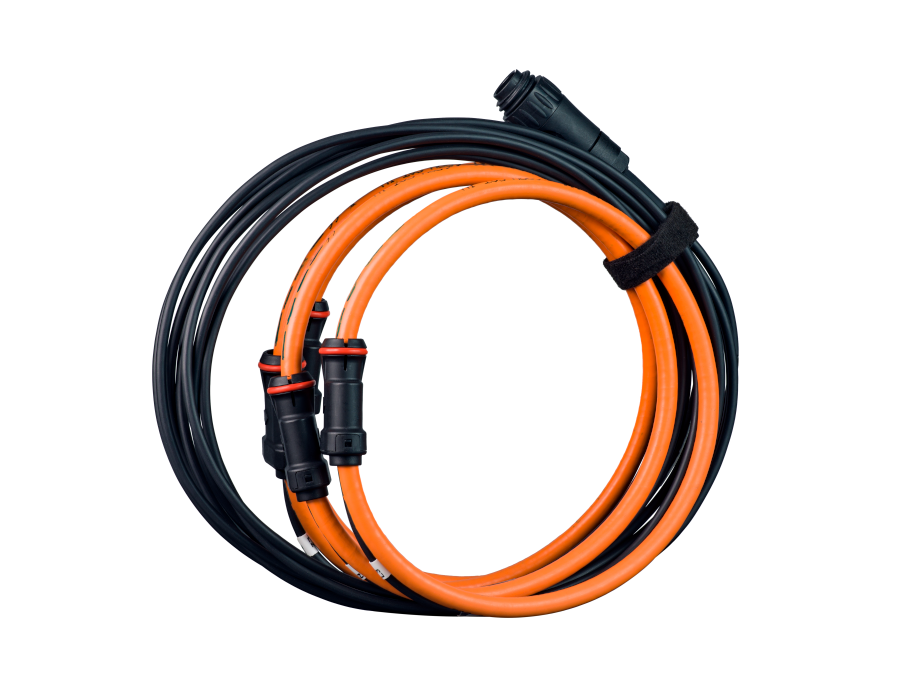
For the connection at the measuring point, PQ-Boxes are offering a variety of current measurement equipment. The PQ-Box detects the type of equipment automatically whereby no further settings are required. When measuring at secondary side of CTs, we recommend using mini current clamps. The transducer factor of the external CT has to be set in general settings of the device.
measurement in low voltage 1…3000 A
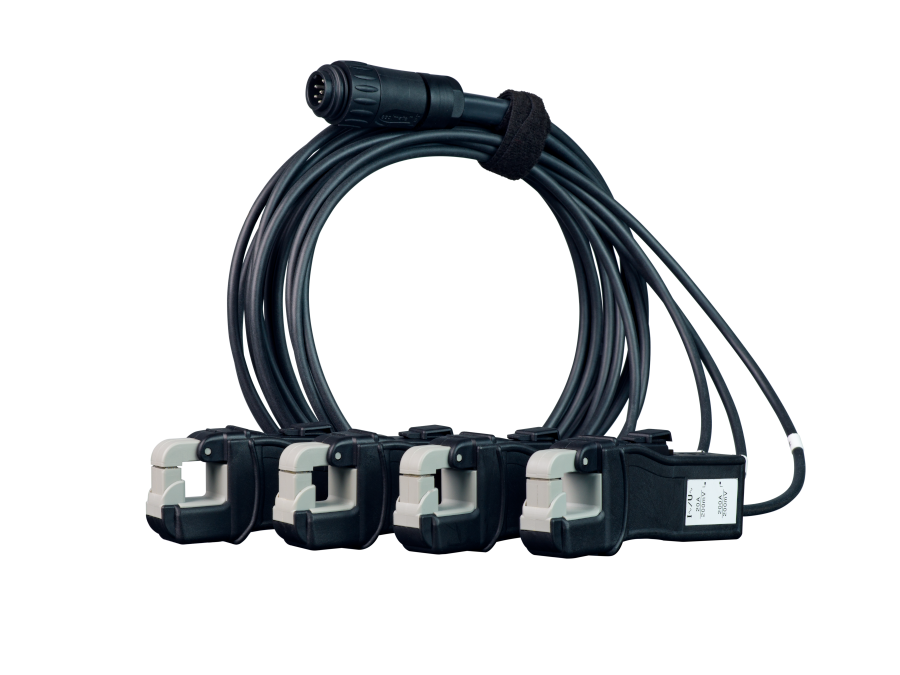
secondary side of CTs in medium and high voltage
When measuring at secondary side of CTs, we recommend using mini current clamps. The transducer factor of the external CT has to be set in general settings of the device. The voltage leads of PQ-Box can be connected directly to the bus bar (<1000 V) or the secondary side of VT with help of the included dolphin or magnetic voltage probes. By pressing the “play” button on PQ-Box or via the WinPQ mobil software, the recording starts. As the disturbances do not occur on a daily basis, we always recommend a long-term measurement over the period of one week.
The main problems in the power supply network occur due to voltage fluctuations and network dips. In order to find problems in the network and to determine the cause exactly, measurements should be carried out until the disturbance occurs again. Voltage extreme values and current maximum values are determined with the shortest possible measuring interval and recorded over a long period. The smallest possible measuring interval is a sine half-wave (10 ms at 50 Hz). The PQ-Box 50 is equipped with a large memory (1 GByte) and records over 2500 different measured values in parallel over long periods of up to one year.
Data evaluation
After loading a measurement file, WinPQ mobil software provides a number of automatic standard evaluation options:
- Generate automatic report according to EN 50160, IEC61000-2-2 or IEC61000-2-4
- Generate voltage harmonics report
- Generate current harmonics report
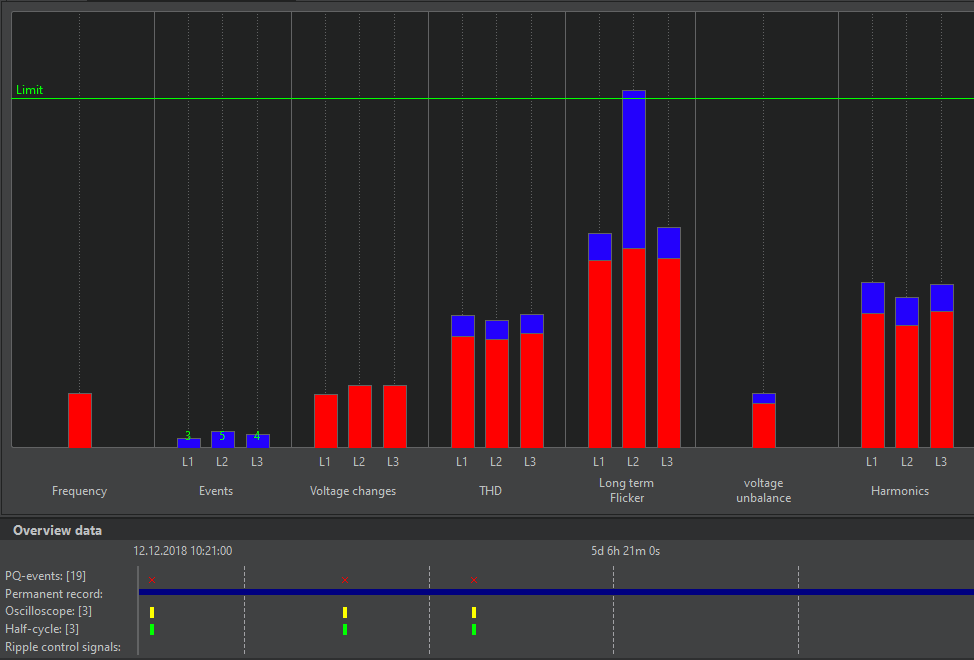
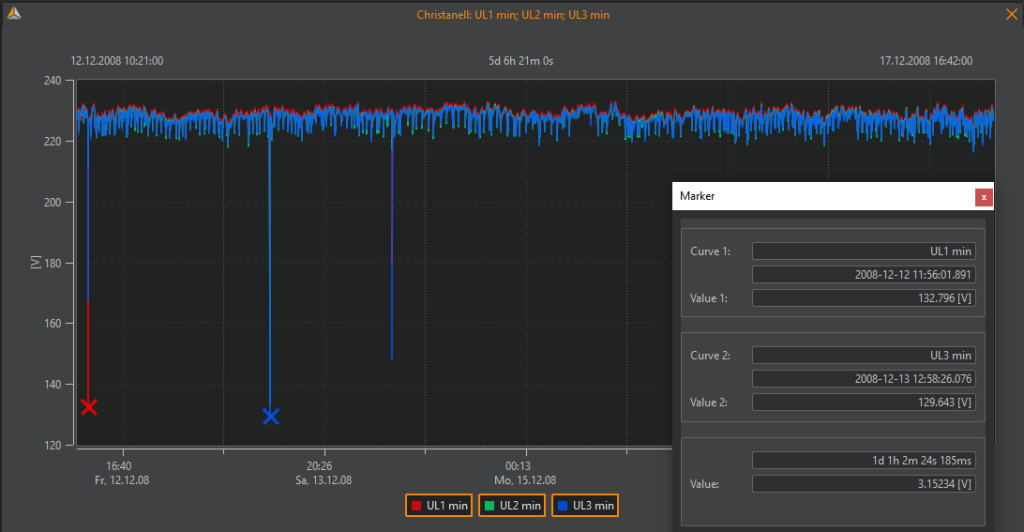
The overview graph of the measurement data shows 3 oscilloscope records (sampling rate 20,480Hz), three 10 ms RMS disturbance records, as well as power quality limit violations. The white dividing lines show the change of day in each case. Therefore, there was a disturbance in the network on the first three days of the measurement, which the PQ-Box 50 detected and recorded automatically with fast recorders. Figure 4 shows the extreme values (minimum) of voltages UL1, UL2 and UL3. Three deep voltage dips occurred during the measuring period. The marker function shows the lowest values at about 129 V.
For the next stage of evaluation we recommend to switch to the disturbance recorder view. It is possible to access the recorder view via 2 paths:
- Access to disturbance recorder view via left click on recorder symbol in timeline, see Figure 5
- Access to disturbance recorder view via menu on the left, see Figure 6
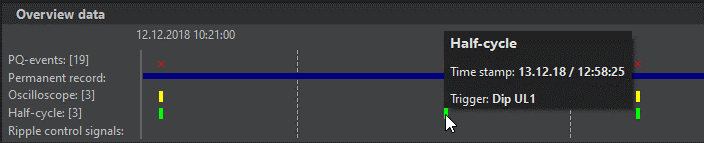
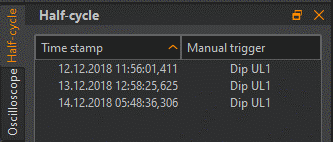
Evaluation of triggered half-cycle disturbance recorders
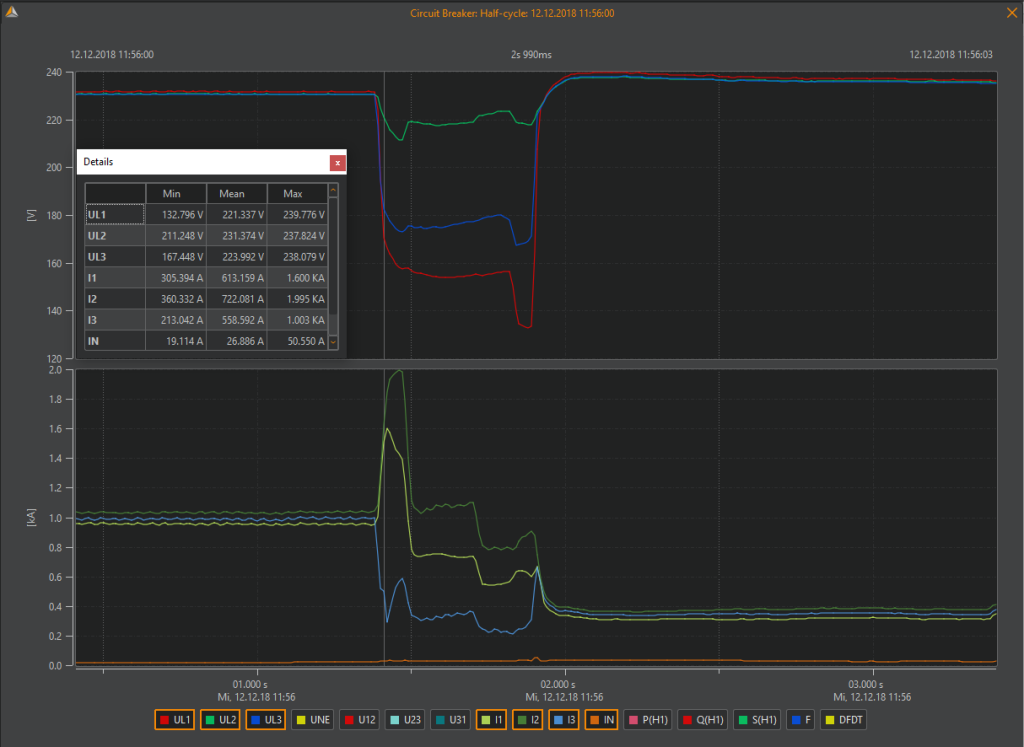
If the set limit values are exceeded or undershot, the PQ-Box 50 additionally starts recorders at different sampling rates. Figure 7 shows a 10 ms rms recording of a voltage dip. An increase in the current of the connected system from 1,000 A to 1,980 A can be detected. The voltage dropped to 132.796 V during this dip.
A voltage dip according to DIN EN 50160 occurs when the supply voltage drops to a value below 90 % of the nominal voltage or 90 % of the agreed voltage (MV grid). In the case of a voltage dip, the residual voltage is greater than 1 %. In other cases, it is called a voltage interruption.
Finding the source of the problem
Could the current increase from 1000 A to 1980 A cause a voltage drop? – No, this would not be explainable at this level by the network impedance. In addition, the course of the voltages does not fit exactly to the course of the currents as the cause. At the time of the current maximum value, the voltage had not reached its minimum value.
Thus, the cause of the voltage dips is to be found in the network of the upstream power supplier. Voltage dips in power supply networks are unpredictable and in most cases unavoidable events. Sensitive systems and equipment must be protected against these voltage dips by measures taken by the customer. The largest proportion of these disturbances is in the time range of less than 1 second.
Explanation for the reaction of the load
In this case, the connected machines have tried to compensate for the reduced voltage with an increased current in order to keep their output power at a constant level. Since the current at the end of the fault was only 350 A, obviously the voltage drop caused many parts of the industrial plant to shut down. Due to the current increase on phases L1 and L2 to almost 2000 A, a circuit breaker correctly switched off the production plant. A few consumers remained in operation, which explains the 350A current after the fault.
Example for a load as cause for a voltage dip
For illustration, Figure 8 shows another measurement, where the consumer, a 4MW drive motor, causes the voltage drop in a 6 kV medium-voltage network.
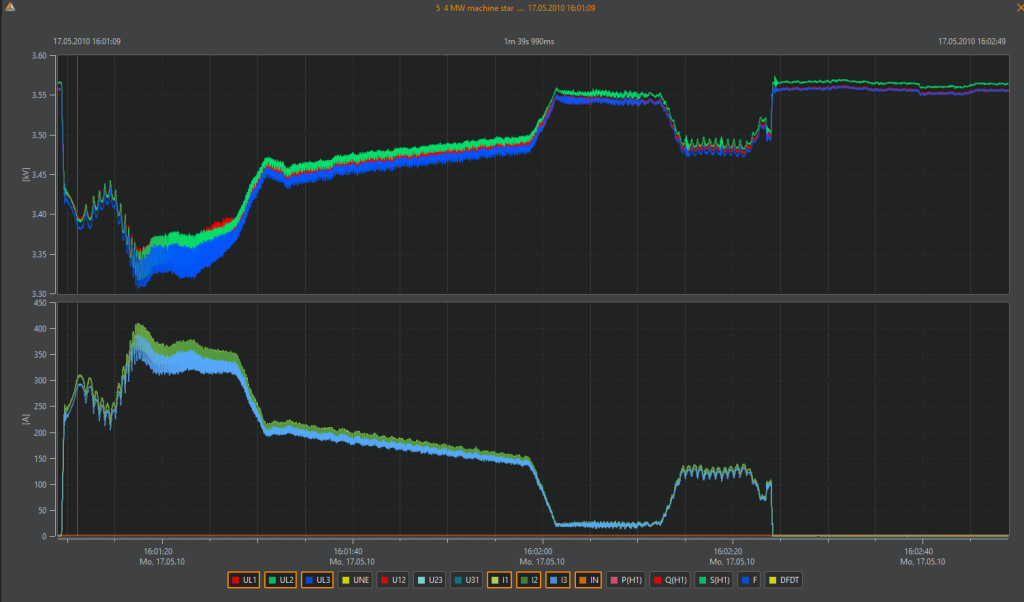
In this measurement example, the current of the motor is clearly the cause of the voltage dip in the network. The voltage dip follows the current curve. In order to be able to record the complete motor start-up for a drive with this power rating, the power analyzer must be able to record very long fault records.
Note: The recorders can be configured to record up to 600 seconds in 10 ms resolution with free choice of pre and post history in all our PQ-Boxes. The set length of the fault record in Figure 8 is 100 seconds.
Evaluation of the oscilloscopic record
The oscilloscope image offers the possibility to illustrate the sampling points of the input channels. The recording duration and the history can be freely set for all recorders of the PQ-Box 50. Figure 9 illustrates the voltages UL1, UL2, UL3 and the currents IL1, IL2, IL3 from the previous picture as an oscilloscope pic-ture with 20.48 kHz sampling over a period of 500 ms. This graph gives additional information about the waveform of voltage and current. It is possible to see transient events with this visualization.
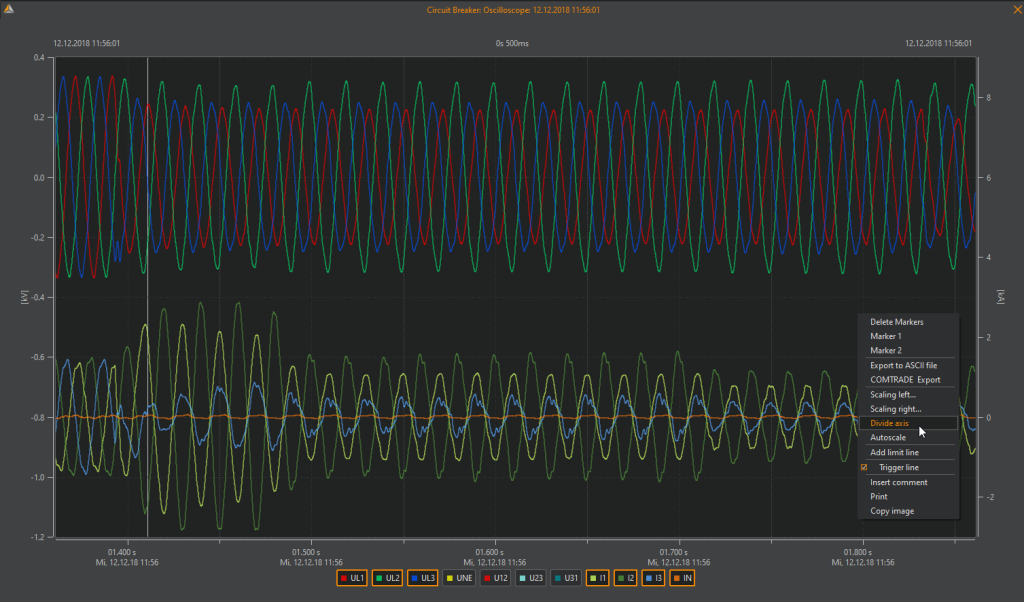
Note: All visualizations can be printed or exported as PDF document including all comments and cursors.
In some cases, it is useful to analyse the current and voltage of individual phases with a synchronous zero line, in order to detect phase shifts between current and voltage during the course of the fault. An example for this kind of evaluation in given in Figure 10.
Summary
- Parameter templates for industrial grids and current clamp detection allow an easy setup and installation of the PQ-Box at the measurement location.
- The easy to generate EN 50160 report provides an overview about all power quality parameters.
- Cyclic data of the PQ-Box contains extreme values of voltage, current and power, which can be used to find critical moments in the measurement period.
- Disturbance records (10 ms and oscilloscopic data) are triggered by violations of norm limits and show detailed information about the behaviour of load and grid.
Author
Jürgen Blum, Produktmanager Power Quality Mobil