This article explains tips and tricks for performing power quality measurements. It explains which connection errors can be made and which preliminary considerations should be made before using a measuring device. With regard to the choice of measuring device, the decision between a mobile measuring device and a permanently installed power analyzer is discussed.
This topic is divided into two articles (Tips and Tricks Part 1 and Part 2).
Fixed power quality devices vs. mobile power analyzers.
Both types of devices have advantages and disadvantages. Generally, a mobile analyzer is used when an acute problem has occurred in the network and a measurement needs to be made very quickly. For example, if a power quality problem is suspected in a production plant. In this case, a mobile device is installed in the network to find out what might have happened days ago. This often works, but of course not always. If the system went down due to a peculiar constellation that cannot be traced during the mobile measurements, or if the network conditions have changed, it may be difficult to explain the problem with a mobile device. In these cases, it may be helpful to leave the measuring device installed until the said fault occurs again.
One advantage of permanently installed measuring devices is the possibility of reverse value analysis. Due to the permanent recording of all network parameters over a very long measuring period, it is possible to precisely analyze the time of the disturbance after a disturbance in the energy network. With a storage capacity of over a year, it is possible to look back over a very long period of time in the event of a network problem in order to identify recurring points in time with similar disturbance patterns. By correlating plant currents and voltages, it is usually possible to determine whether the fault originated in the plant itself or in the grid.
However, a disadvantage of these devices is that they are not usually installed at the depth of the networks where the consumers are located. Typically, permanently installed PQ devices sit near the low-voltage distribution and close to the transformer. In other words, located at the greatest short-circuit power point in the low-voltage network. Here, however, the feedback effects of the consumer currents have a smaller impact than at the end of the line.
Mobile meters, on the other hand, make it possible to go deep into the network and measure points with the lowest short-circuit power. They are particularly useful in searching for sources of interference by penetrating to the last power strip and recording the voltage quality directly at the load. In this regard, fixed devices are limited and must restrict themselves to fixed points in the network.
When measuring the voltage quality standards, it is usually sufficient to record the voltages. With the aid of the standard it can be checked whether these are within the permitted tolerance range. In order to identify the cause of disturbances, the current of the load is usually required. If the current can explain the disturbance on the voltage as being the cause, then the originator is to be looked for in the measuring point. If the current does not explain the disturbance on the voltage, due to the fact that the consumer did not draw current exactly at that moment, the originator must be sought in front of the meter
When measuring currents, it is important to consider beforehand whether a fault is being sought or whether the most accurate possible measurements of power and energy at a load are desired. In order to be able to measure precisely, it is unfavorable to use a Rogowski coil with a large measuring range of 3000A, if only 10A are measured. In this case, the measurement error can become very large. To evaluate power, energy and cosine phi as accurately as possible, one should always be in the range of 50% to 100% of the current clamp. The largest measurement error that occurs in measurement technology is caused by the current clamps themselves, as these often have a lower accuracy than the measuring device.
When analyzing power quality disturbances, such as voltage dips, it is of great importance to identify the load that draws pulsed high currents. It would be unfavorable here to operate a current clamp in the measuring range of the nominal currents of the plant. For example, inrush currents of drives or also inrush peaks in lighting systems can have a ½ period extreme value of the currents of 10 times the rated current. In such cases, it makes more sense to use a current clamp with a measuring range of at least 5 to 10 times greater than the rated current. This ensures that high starting currents are not limited by the clamp or the measuring device.
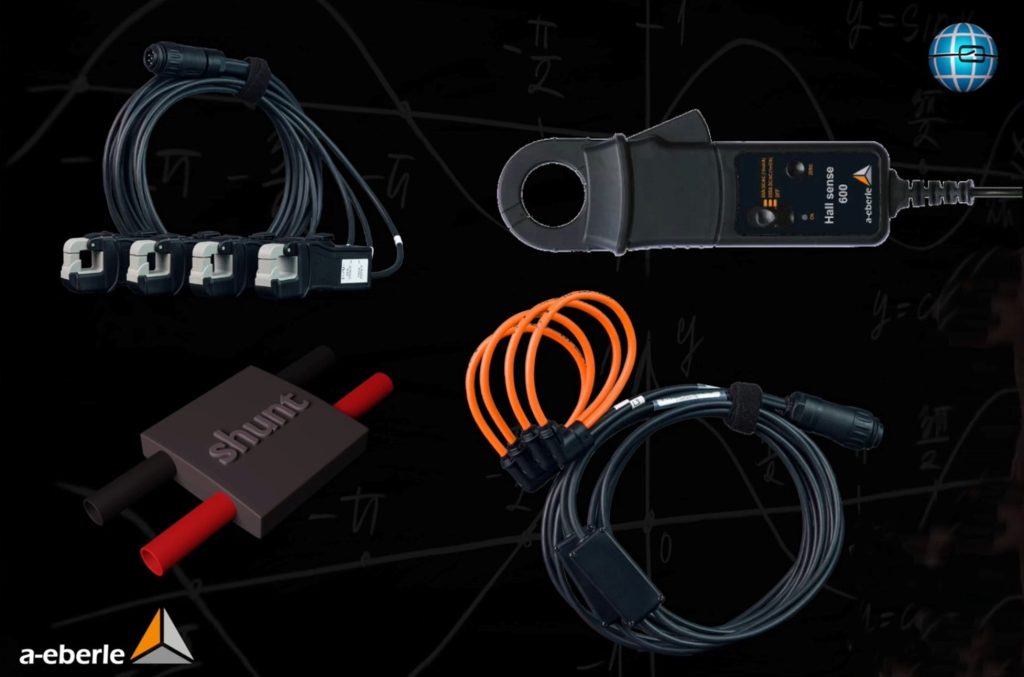
Various methods are available for measuring currents. One possibility is to use a standard AC clamp. However, this has the disadvantage that it cannot measure DC currents.
A clamp with a Hall sensor is suitable for measuring DC currents. This can measure both AC and DC. A very precise, but inconvenient method is to use a current shunt that is inserted into the line. This outputs a voltage proportional to the current. This method can also measure both AC and DC, but it requires the wires to be disconnected.
Another option for measuring current is to use Rogowski clamps. Each of these measurement methods has its own advantages and disadvantages, which will be explained in more detail in an extra article.
Four ways
Read more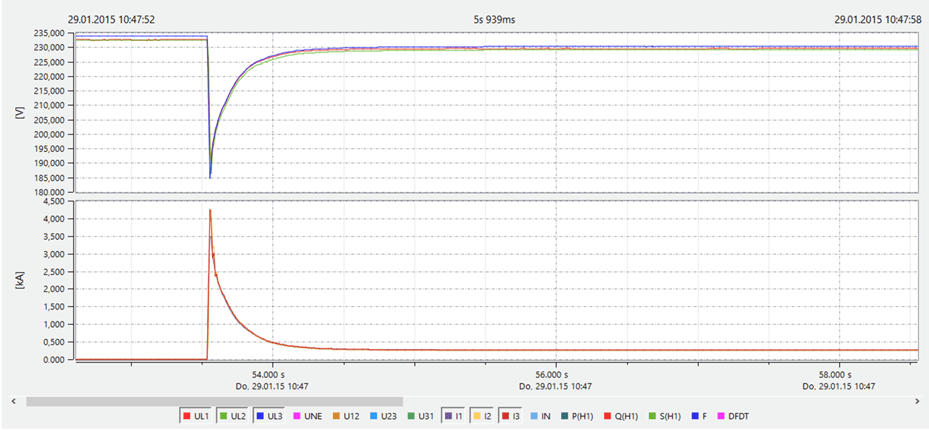
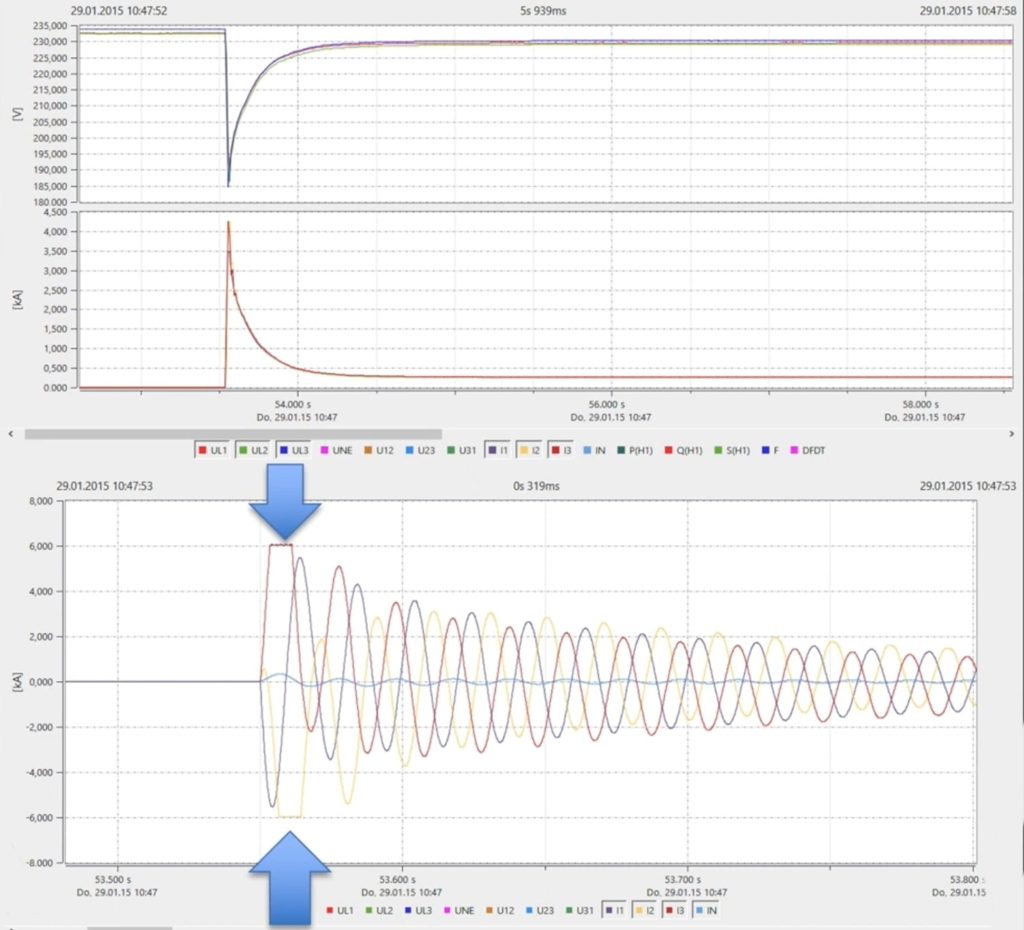
Figure 2 shows the starting current of a large motor and the corresponding voltage drop. The current was measured using a 3000A Rogowski clamp. The result of the measurement showed a maximum value of 4,250 amperes. A simultaneous acquisition of the voltage showed a voltage drop to 185V.
A deeper analysis with the help of an oscilloscope image revealed that the sine value was capped at the top and
thus the actual current was much higher.
Since the Rogowski coil reached its measuring range limit at a peak value of 6000 amperes, the actual starting current could not be recorded correctly.
Selection of the appropriate measurement location.
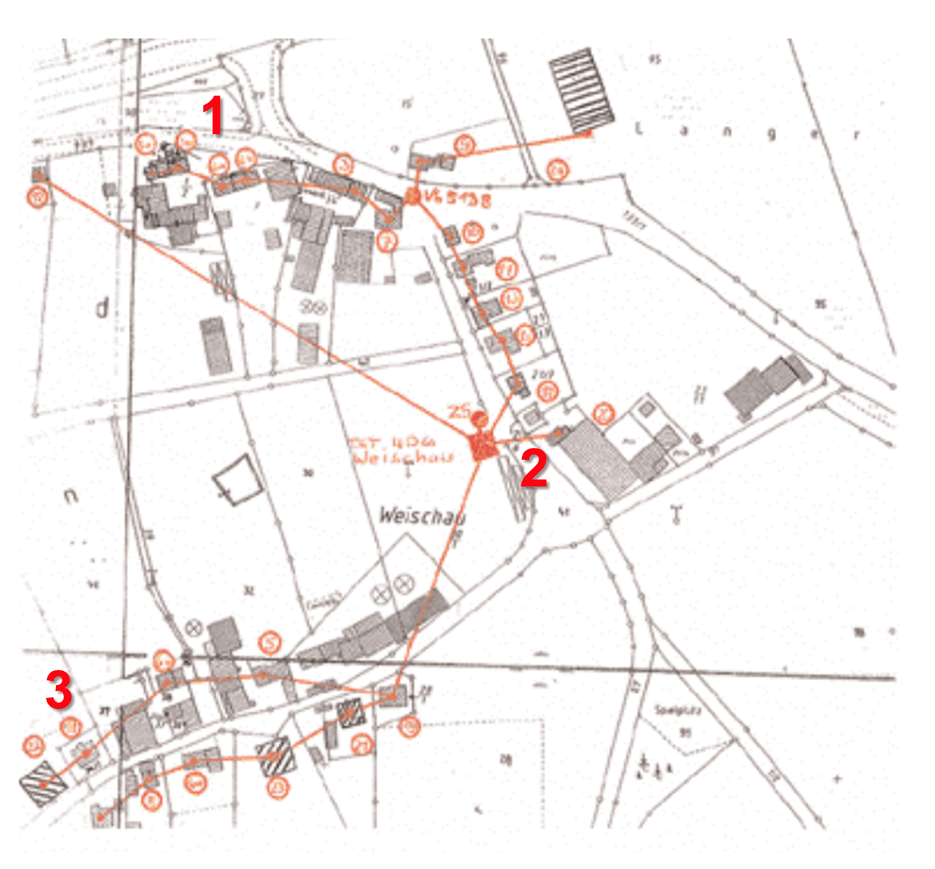
Before devices are installed in the network, it is advisable to consider which measurements are to be carried out, where they are to be carried out and how the originator can be found most quickly. In this case, the local network received a large number of complaints from the utility’s customers. To search for these disturbances, the network is first examined. At measuring point 2, there is an industrial customer who is probably the cause of the impairments of the other customers. Therefore, it makes sense to first look for the cause of the disturbances in this customer.
Before starting the network feed, careful consideration is given to which measurements are to be carried out and at which measuring points this can be done most quickly
The decision whether to measure at the spur or at the station depends on the individual requirements. A measurement at the spur allows a more detailed analysis of the network reactions on the voltage, but the identification of the originator remains limited. In contrast, a measurement at the station allows an overview of all consumer currents on the relevant cable run, but the detection of disturbances on the voltage is limited due to the high short-circuit power.
In this case, measurements were made with two measuring devices simultaneously over a period of one week. This made it possible to carry out a precise analysis and it was possible to determine that the disturbances in the network only occurred six days a week, but not on Sunday. However, the industrial customer did not transmit any consumer electricity on the Saturday on which disturbances were also present and can therefore be excluded as the originator of the disturbances.
Tips for performing measurements with PQ boxes:
- Always perform measurements for at least one week
- Measurements of all times of the day and all times of the night, as well as the weekend
- Measurements in parallel at several measuring points accelerate fault detection
A recommended tip for carrying out measurements is to measure for at least one week. This should include all times of the day and night as well as the weekend, even if the industrial customer shuts down its facilities on the weekend. In particular, the times when no disturbances occur provide valuable information on what changes occur, for example, on Mondays when the customer starts operating. In the case described, the plant was located at the end of the line at measuring point 1. A CNC machine with a connected load of 12 KW was operated in the plant’s workshop. When the CNC lathe was in operation,
disturbances occurred in the entire local network.
Author
Jürgen Blum, Product Manager Power Quality Mobil