Following the expiry of the transitional periods for the certification of generation units according to the VDE connection guidelines in the German area, numerous questions repeatedly arise regarding the correct installation of the fault recorder system required to demonstrate compliance according to the European Directive for Generation Units (2016/631). The following guide should help to find out, on the one hand, which special features are required and, on the other hand, which components must be selected for the system to work.
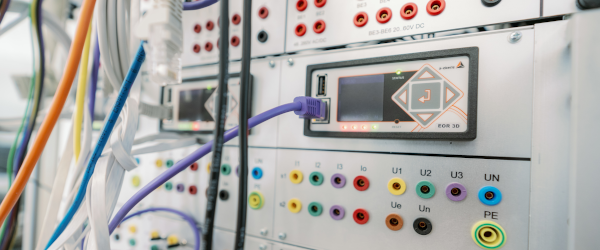
Testing with high-precision measurement technology is necessary.
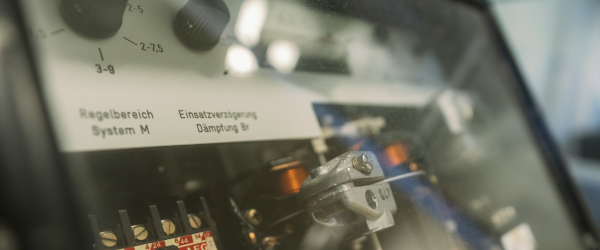
Planning errors in the construction of large-scale generation units often lead to increased costs and delayed certification. Admittedly, this is also due to a very complex issue. According to chapter 6.4 of VDE-AR 4110, fault recording and power quality monitoring are recommended for transfer stations in justified cases. For systems in the individual verification procedure, the requirement is formulated in more detail. In that case, a recorder must be installed to “be able to continuously check the requirements for dynamic mains support in live operation, if compliance with the requirements for dynamic mains support could not already be demonstrated by measurements during commissioning” [standardised extract from VDE-AR 4110]. This measurement test must, of course, be carried out using suitable, high-precision measurement technology, tested in accordance with the standard.
The individual verification procedure required for some systems with the installation of a fault recorder for compliance monitoring, to be carried out by an accredited certification body, requires a high degree of coordination between all actors involved. First of all, the appropriate measurement technology, which meets all requirements, must be selected for the verification procedure. In addition, the necessary expertise is required for the correct installation of the measurement technology. Furthermore, certain requirements for the transducers used must be taken into account, as well as the necessary verification to ensure the required accuracies (DAKKS calibrations) of the technologies used. With regard to the subsequent compliance check, an easy-to-implement half-yearly data exchange must be ensured.
This guide provides a practical overview of the most important components to ensure and facilitate a reliable measurement chain.
Requisitos de los registradores de averías
According to Annex F of the connecting guideline, the fault recorder requires certification according to class A of IEC 61000-4-30 (Ed. 3) to ensure safety and accuracy of measurement. Annex F requires the sampling frequency of the recorders to be at least 1 kHz. However, for the evaluation of voltage and current supraharmonics in the frequency band range of 2-9 kHz, which is subdivided into 200 Hz bands according to DIN EN 61000-4-7, it is essential to provide higher sampling frequencies for the measurement. Therefore, a minimum sampling frequency of 20 kHz is required to be able to perform the required measurement according to FGW TR 3.
In order to ensure consistent data recording even in case of failure and power failure and to document the reaction of EZA even in case of power failure, a UPS system for the measuring device and additional components such as the communication infrastructure (switches, gateways, servers) is recommended in any case. Of course, there must be no loss of parameters and data in the power quality measuring device used, even in a de-energised state. This must be ensured by the measuring device and the configuration. Reliable data is required especially in the event of a fault.
In this context, time synchronisation plays an important role. Therefore, an external synchronisation, e.g. via GPS, is necessary to ensure a maximum accuracy in the overall system of up to 25 µs. The accuracy of the entire measurement chain is of great importance in the detection process.
However, the accuracy of the measurement result does not only consist of a high-precision measuring device with a maximum deviation of 0.1% and the corresponding verification, but the total error of the entire measurement chain is significantly influenced by the transducers used.
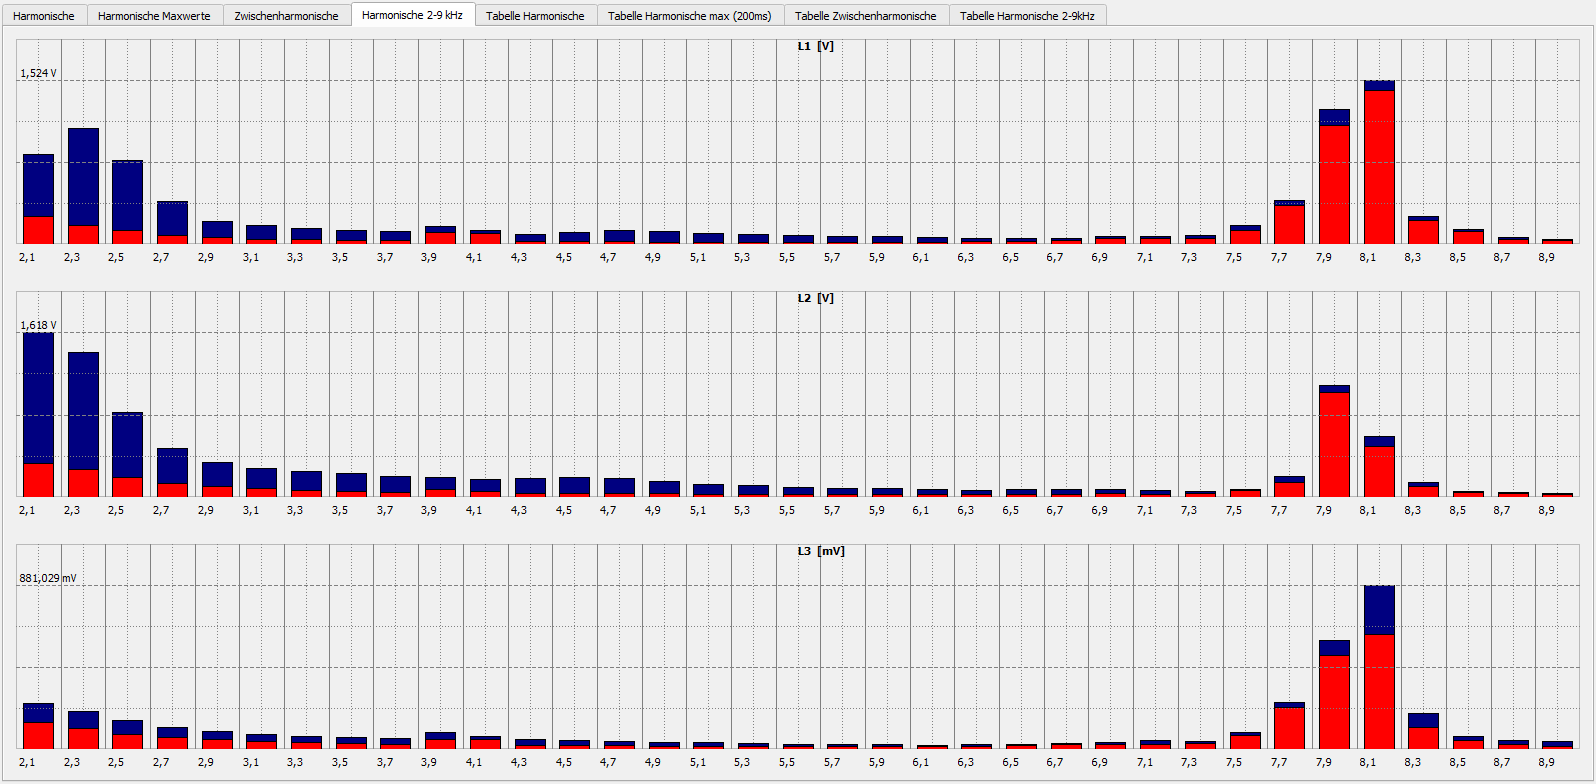
Thus, for example, the transformers used must also be capable of transmitting supra-harmonics without error. In the medium and high voltage range, there is already a wide variety of transformers on the market that can also transmit frequencies in the 2-9 kHz range with deviations <0.1%. Especially in DCA systems with DC link controlled power supply, dominant clock frequencies are often responsible for feedback effects such as increased noise generation, as can be seen in figure 2.
This requires that the fault recorder supports a wide variety of transducer technologies with respect to the input signals.For example, transducers that can pick up the higher frequency range of 2-9 kHz are usually equipped with 3.25 V/√3 outputs instead of 100 V/√3.In any case, the impedance ratio between the transducer output and the encoder input must match. Therefore, it is necessary to check the respective impedance requirements prior to acquisition and to clarify in advance the necessary data for the measuring instrument and the selected measuring input with the supplier of the transducer to be used.
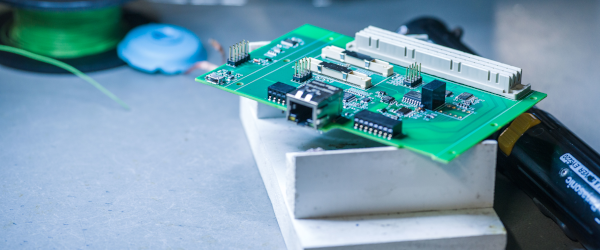
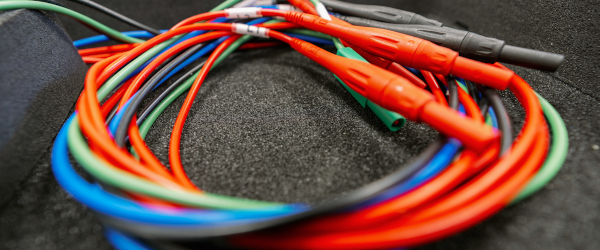
Measuring with sensors
Simple and highly accurate
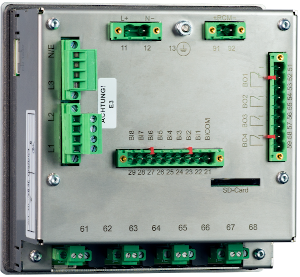
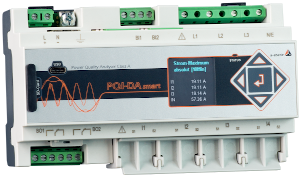
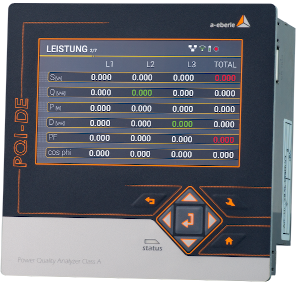
The PQI-DE supports a wide range of combinations and installation situations, both in the area of voltage measurement and through the various current measurement possibilities, also in the area of retrofitting, e.g. through the high-precision Rogowski inputs for current measurement.
- 100 V 2 MOhm || 25 pF
- 100 V / 400 V / 690 V 10 MOhm || 25 pF
- 3.25 V 2 MOhm || 50 pF for small-signal transducers according to IEC 61869-11 (SELV)
- 4 current inputs for transducers 1 A/5 A (MB max. 10 A)
- 4 current inputs for protection transformers 1 A/5 A (MB max. 100 A)
- 4 current inputs for Rogowski clamps (Input 350 mV)
- 4 current inputs for current clamp meter (AC converter 0.5 V input)
DAKKS calibration required
To ensure and guarantee the accuracies, a DAKKS calibration is required before delivery and installation of the measuring device. The standard factory calibration is not sufficient for certification.
For this reason, A. Eberle GmbH & Co. KG requires an extended DAKKS calibration by a certified laboratory, also in the field of supra-harmonics for the measuring devices.
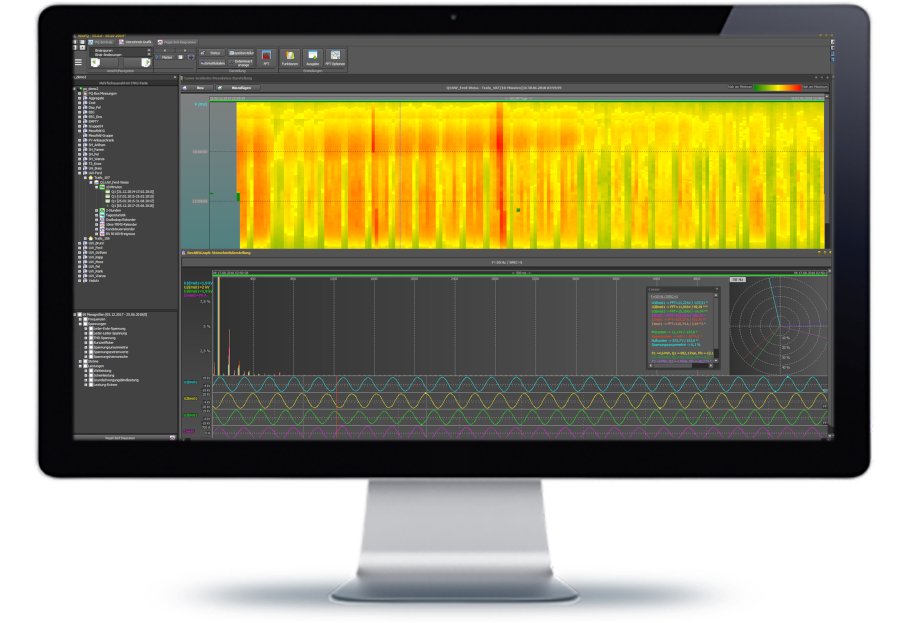
According to the connection guideline, the certification body has the task to evaluate the measurement data at least every six months. For this purpose, a simple and seamless data exchange must be ensured. In addition, the system must be able to provide a suitable software solution to evaluate the data. It is important to use a system with simple, flexible and open interfaces, which can be adapted to on-site conditions and communication solutions.
System requirements
Simple
In the simplest case, the data transfer from the measuring device to the certification body must be done by inserting an SD card and copying the entire internal memory. The readout in a power quality evaluation software works similarly in a plug & play procedure.
Flexible
From simple data transfer by inserting an SD card to automated data transfer via mobile radio, SHDSL or Ethernet: always trouble-free, even with poor connection quality. Diverse and customisable system solutions should be possible.
Open
Comtrade or PQDIF as standard via IEC 61850, IEC 60870-5-104 or Modbus. The measuring instruments and the WinPQ system of A. Eberle GmbH & Co. KG have numerous open standard interfaces and protocols for the transmission of measurement data.
WinPQ: Automatic compliance check of power plants using FRT curves
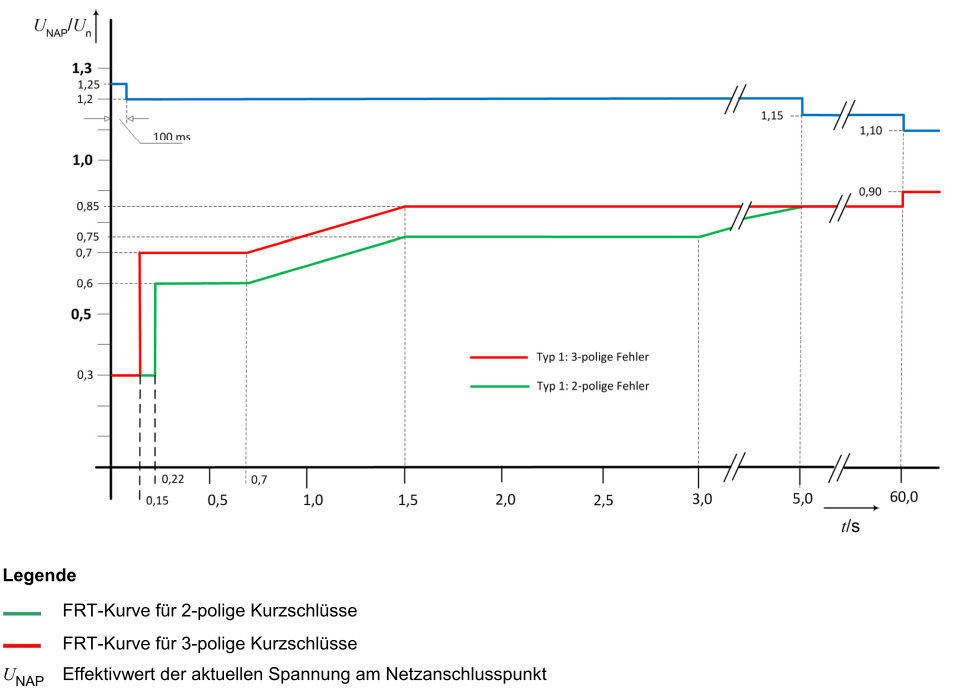
Power plants have to perform dynamic grid support in accordance with the European Grid Code. This requirement applies mainly in case of faults and indicates that generating plants have to comply with the following requirements in case of symmetrical and asymmetrical grid faults:
- There shall be no disconnection of the generating plant in case of undervoltage or overvoltage events within the limits specified according to the type of plant and (FRT curve).
- The grid support requirement also applies in case of several consecutive faults.
- The plants must maintain the grid voltage during the grid failure by injecting a reactive current (reactive power). The reactive current must be supplied in both positive and negative sequence systems depending on the type of fault.
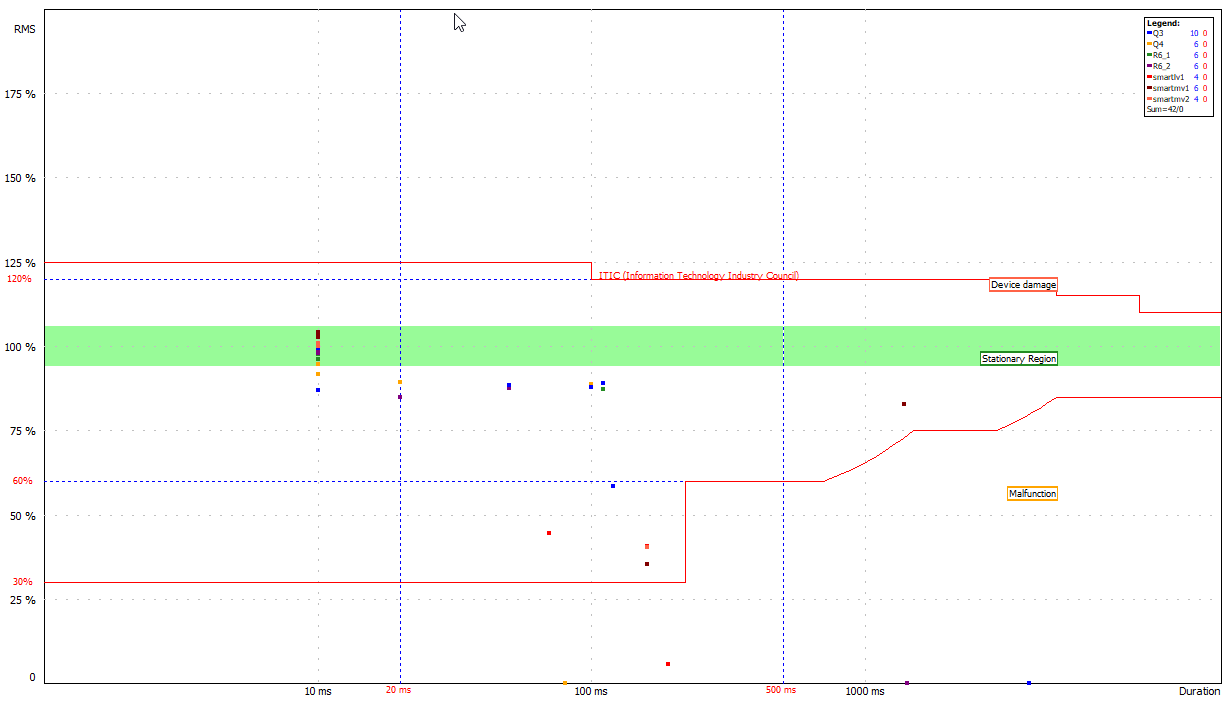
To check the requirement in the various systems, the WinPQ Power Quality system software from version V. 6.2 onwards offers an optional AddOn for automatic fault classification via the FRT curves already present in the system. It is possible to store each measuring point with an FRT curve corresponding to the type of installation. On the one hand, this offers the possibility to classify faults directly over a period of time, e.g. one year (Figure 3). On the other hand, it also allows for an active alarm. In this case, the system only sends an alarm to the plant operator or the designated certifier by e-mail when the value falls below or exceeds the specified characteristic curve, as shown in Figure 4.
It should be noted that the FRT curves provide for a fault evaluation of up to 60 seconds. Therefore, the fault recorder used must be able to provide the measurement data as a 10 ms rms value in any case and this even in the case of several consecutive faults, as this is expressly required by the Grid Code. In this context, it is strongly recommended to calculate the rms value in accordance with IEC 61000-4-30 – Class A Ed. 3 in order to allow uniform and comparable evaluations from a normative point of view.
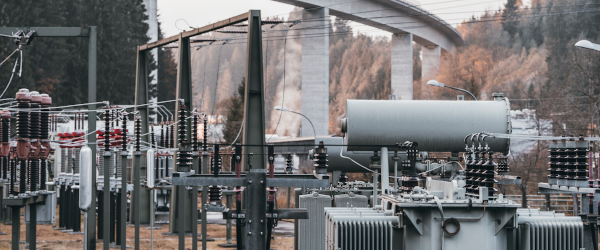
Example of the application of an ACA according to VDE-AR
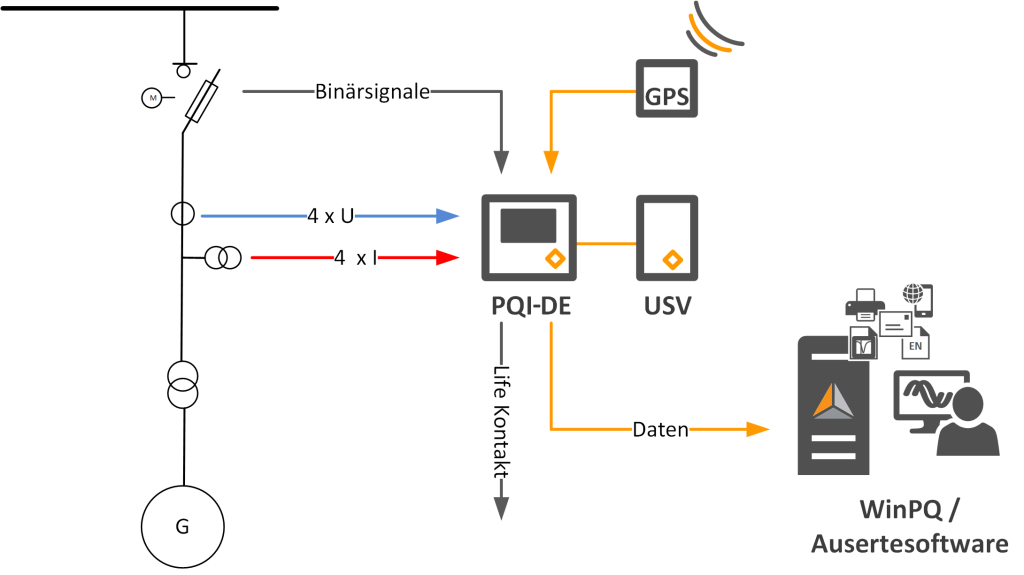
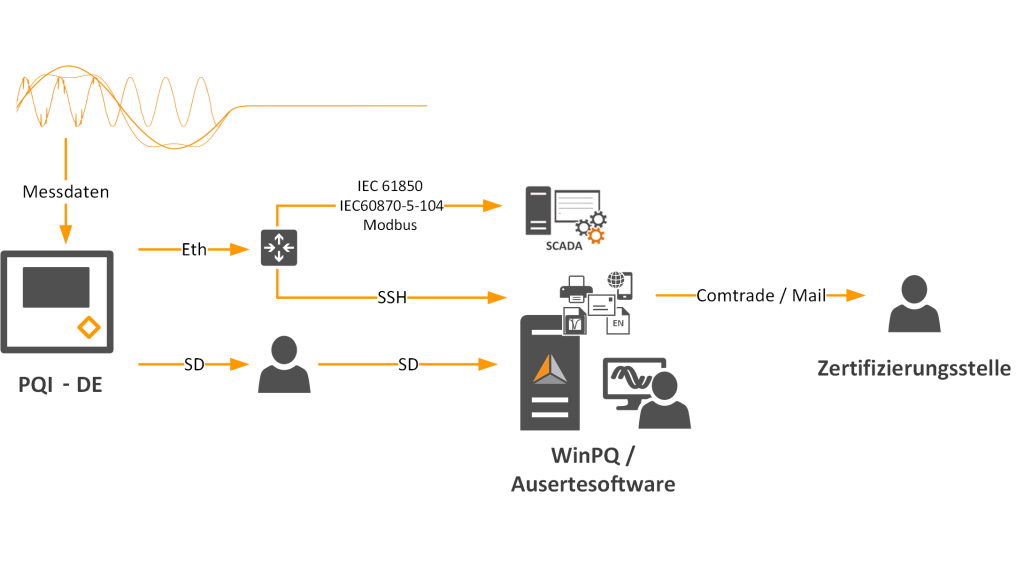
The certification body involved in this project relies on automated data transfer in a standard Comtrade format for automated fault evaluation. Figure 5 shows that in the event of a mains failure, the data from the fault recorder is recorded in the measuring device using the VDE-AR 4110 template approved by the certifier. Subsequently, the data is automatically generated by the WinPQ system software installed on site (SSH) and sent directly to the server of the certification body. In the event of a failure, the server directly evaluates the data and checks whether the power plant is operating in a grid-serving manner.
Figure 5: Implementation of a power plant in accordance with VDE-AR
The customer also has the possibility to visualise and evaluate the measured power quality values at any time by means of a clear report. In case of communication difficulties due to an unbuffered network, the customer has the option of reading the data directly from the measuring device via an SD card and providing this data. In parallel, the high-precision measured values U, I, P, Q as well as the daily statistics of the PQ events are transmitted via a standard protocol – in this case IEC 61850 – to a SCADA system for on-site display and also for issuing alarms.
Conclusion
Through a uniform and coordinated procedure of all persons and companies involved, a high degree of cost savings and efficiency can be achieved for both the certifier and the operator of the power plants.
We will be happy to assist you during this process with our safe and certified class A (Ed. 3) measuring devices PQI-DE and PQI-DA smart in combination with the WinPQ power quality system software as well as our experience in the field of services for the operation and installation of measuring devices.
Please contact us in good time before selecting the components – we will be happy to help you.
Author
Fabian Leppich, Product Manager Power Quality System