Solar photovoltaics in Malta have increased substantially over the years, both at large scale and residential scale. The present installed capacity is already having a negative impact on Malta’s’ grid infrastructure, causing problems due to the reverse power flows (resulting from oversupply) and related issues such as voltage rise. This paper considers the integration of the »LVRSys® Low-Voltage Regulation System« in a low voltage grid in a semi-rural area in Malta.
A thyristor-controlled transformer-based low voltage regulator was modelled and simulated in MATLAB/Simulink using the PLECS blockset. Experimental results were also obtained via measurements of the voltage profiles at 70% of the actual low voltage feeder that showed several instances of over and under voltage events. The outputs obtained from the simulation model strongly agreed with those obtained from the field testing thereby validating the simulation models that were developed in this study. Results show that the voltage in the low-voltage grid was successfully regulated to around the nominal voltage of 240 V.
LVRSys®
The »LVRSys® – Low-Voltage Regulation System« was developed to solve voltage stability problems due to the integration of electromobility, photovoltaics and heat pumps in the low-voltage grid. It represents an economical and flexible alternative to costly and time-consuming line extensions.
1 INTRODUCTION
Solar photovoltaic (PV) generation is presently the predominant renewable energy source (RES) in Malta. In the coming years, Malta is expected to continue its decarbonisation strategy while making the most out of its limitations, that is, high population density and limited land availability. Photovoltaic generation is expected to remain Malta’s highest RES contributor towards achieving the 11.5% renewable energy source (RES) share set for 2030. In Malta, the photovoltaic systems are concentrated within an area of only 316 km2, and thus photovoltaic generation is highly susceptible to rapid fluctuations in output power due to cloud coverage. Hence, photovoltaics pose a significant risk to grid stability due to their inherent intermittency. This is presently being mitigated by the Malta–Italy high voltage AC interconnector and the central power generation. The present RES share is already having an impact on Malta’s’ grid infrastructure, causing problems such as voltage rise and reverse power flows [1].
The Maltese power system was built with legacy grid infrastructure to deliver unidirectional power flows where the power flows from the central generation to the consumers. Future increases in photovoltaic penetration will add more operational, planning, and management challenges to the distribution system operator (DSO). Significant investments in network reinforcement will be required as the present infrastructure shall increasingly struggle. This poses a huge challenge for the DSO because during periods of high consumption the electrical lines experience significant voltage drops, whilst during high photovoltaic generation, the electrical lines experience an increase in voltage due to the reverse power flow. These voltage variations are expected to become more pronounced, as Malta together with the rest of the European Union, is pushing to have more electric vehicles on the road. Fast chargers are presently being installed on the island at a fast pace.
The DSO must maintain the voltage levels in accordance with the specifications defined in the EN50160 standard [2]. According to this standard, for normal operation, the 10 min rms values of the low voltage supply voltage has to be within the range of ±10% of the nominal voltage for more than 95% of the time during each period of one week. Prior to the integration of electric vehicles (EVs), voltage-related issues were nearly always due to low-voltages. These issues were dealt with in a very straightforward way, with off-load tap changes being carried out to increase the voltage at distribution sub-stations. This type of corrective action cannot be applied in the today’s scenario since the network voltage fluctuates both above and below the nominal voltage daily. To make matters worse, if a transformer was set to increase the sub-station voltage to compensate for voltage drops, this setting will worsen the voltage rise affect during reverse power flows.
A number of practical solutions can be considered to mitigate the voltage fluctuations caused by the present bi-directional power flows in today’s electrical network. The obvious options consist of curtailing the photovoltaic generation (reduction of the output by photovoltaic systems during periods of excess generation) and electric vehicle (EV) shedding (limit the amount of EVs being charged) when the load demand on the network is too high. However, active power curtailment and EV load shedding create unfair opportunities for consumers and prosumers positioned at different points within the distribution grid, or even on the same feeder. Alternatively, the distribution network could be reinforced and upgraded by increasing the size of its transformers and cables. However, this option might not be reasonable due to the high cost and the lead times required for deployment. There are other technical solutions which can be applied, some of which make use of commercially available equipment. These are discussed in the following section.
1.1 Methods for on-load voltage regulation in power systems
There are various solutions that could be applied to mitigate the voltage variations in the low voltage network. Some technologies employ direct intervention on the voltage, whilst others use intelligent control to regulate the voltage by deploying energy storage systems or reactive power control. The following list summarizes the technologies and strategies used for voltage correction on the low voltage network:
- On-load tap changer (OLTC)
- Battery based energy storage systems
- Static VAR compensators (SVC)
- Dynamic voltage restorer (DVR)
- Reactive power control via grid connected inverters
- Step voltage regulator (SVR)
- »LVRSys®«-Low-Voltage Regulation System
On-Load Tap-Changer (OLTC)
The OLTC is a widely used solution for voltage regulation in power networks. These devices enable the selection of different transformer taps to adjust the output voltage without disconnecting the load. A typical example of a diverter type tap changer is shown in Figure 1. OLTCs are mainly installed on distribution transformers that link transmission systems with distribution grids.
The OLTC carries out line drop compensation (LDC) by adjusting the tap positions, for example, by applying higher voltages when loads increase. The voltage reference must be carefully selected to maintain the voltage of several feeders, connected to a single transformer and each with a different voltage profile, within the admissible range all over the network.
The OLTC target voltage reference can be determined by considering the maximum voltage drop between the transformer sending-end busbar to the most affected feeder end, ensuring that the minimum load voltage does not fall below the lower limit defined in EN50160. In the past, OLTCs were only used to regulate voltage drops. Therefore, conventional OLTC voltage control strategies assume unidirectional power flows.
However, nowadays the situation has changed to one where voltage rise occurs during high photovoltaic generation (and reverse power flows due to a low load demand). It is also envisaged that higher voltage drops will be experienced when large scale charging of EVs becomes common place. The authors in [4] considered a voltage droop control method applied to OLTCs on both medium voltage and low voltage transformers to maintain the correct voltage level during large photovoltaic power generation.

The autonomous control of medium voltage/low voltage transformers showed that the voltage rise could be controlled allowing for a further increase in the photovoltaic installation capacity. However, the resulting power dynamics are an important factor that needs to be considered in scenarios with high penetration of photovoltaic systems. The power network experiences rapid changes in power, for example, during instances when there are passing clouds. This requires rapid operation from the motorised contacts of the OLTC which affects the OLTC’s reliability and lifetime. An additional operational constraint is that the OLTC can be required to operate with unbalanced three phase power flows due to the wide-scale deployment of single-phase roof-top photovoltaic installations in the low voltage network. The OLTC typically fails to operate satisfactorily under these circumstances because simultaneous individual phase correction is not straightforward.
On-Load Tap-Changer (OLTC) in Combination With Energy Storage Systems
Even with these limitations, OLTCs are nowadays an integral part of distribution networks. It has become necessary to keep this expensive equipment functional under optimal working conditions in order to reduce the wear which is caused by rapidly changing voltage demands and the number of tap change operations. Several approaches have been proposed in literature to mitigate the additional stresses on OLTCs. One way to mitigate the effects of the unpredictable rapid changes in the network power flows is through the deployment of energy storage systems (ESS). ESSs can be used to take care of the additional workload experienced by the OLTCs due to the voltage fluctuations. In [5, 6], coordination between a battery energy storage system (BESS) and an OLTC was performed to maintain acceptable voltage levels while minimising the number of OLTC operations and the energy cycled from the BESS. An algorithm, based on a day-ahead forecast was proposed in [6] to determine the optimal system settings and it was found to improve the coordination among all system components. Alternative strategies have been proposed to mitigate rapid and frequent adjustments in OLTCs during photovoltaic power fluctuations.
Reactive Power Control via Grid-Connected Inverters
These strategies perform voltage regulation through reactive power control using the grid-connected photovoltaic inverters themselves, thereby reducing the need for tap operations on the OLTC. In [7], an optimization method was developed for coordination of OLTCs and the photovoltaic inverters. The optimization problem aimed to minimize voltage deviations and reduce tap operations. Simulations showed that the method remained effective even in the presence of voltage unbalances and substantial load forecast errors. However, communication between OLTCs and inverters is required for this method to work. The authors in [8, 9] proposed techniques that operate autonomously without requiring communication infrastructure. In [8], the photovoltaic controller monitored rapid power fluctuations due to changes in the solar irradiance and sourced/absorbed reactive power according to a predefined factor. The OLTC controller continuously observed the variations in the real and reactive power and disregarded unnecessary tap adjustment actions which were known to be triggered by the photovoltaic inverter power injection/absorption. However, in some cases, the output by the photovoltaic sources must be curtailed to allow the OLTC to regulate the voltage. Therefore, while this strategy did not require a communication network, it had the main disadvantage of reducing the energy yield from the photovoltaic generation. In [9], a system of coordination was proposed which allowed operation without any loss of photovoltaic generation. The operation was based on a decentralized control scheme where corrective actions were taken only based on local measurements and a signalling method was used for coordination between the OLTCs and the inverters.
On-Load Tap-Changer (OLTC) in Combination With Static VAR Compensators (SVC)
A technology which has been used for grid voltage regulation well before the era of distributed generation is the Static VAR Compensator (SVC). Their role in voltage regulation is well established in literature. The SVC consists of shunt connected passive elements which regulate the voltage by absorbing/sourcing reactive power from/to the power network controlled through a power converter (normally thyristorbased). SVCs are relatively low cost, require simple control, are maintenance free, and unlike the OLTC, can be retrofitted with existing substation transformers.
In [10, 11], a method was presented for integrating SVCs into networks with existing OLTCs, aimed at reducing operations on the OLTC. An analysis of a low voltage network with an OLTC on the medium voltage/low voltage transformer was carried out by the authors in [12]. Results showed that the tap-changing operation of the OLTC was substantially reduced by correctly rating an SVC in coordination with a centralized control. The SVC was controlled in such a way to identify the voltage variation and mitigated this effect in coexistence with the locally controlled distributed photovoltaic inverters which were also contributing to the voltage regulation. The disadvantage of SVCs is that they are ac-controlled systems and thus continuous losses are associated with their operation.

Dynamic Voltage Restorer (DVR)
Active series voltage compensators, called a dynamic voltage restorer (DVRs) can also be used to regulate the supply voltage. DVRs consist of a primary side transformer which is driven by a pulse width modulation switching converter fed from the supply voltage as shown in Figure 2. The DVR injects an aiding or opposing voltage during a voltage dip or surge [12, 13].
Normally, a DVR consists of a two-stage power converter with a DC link, resulting in high losses due to the dual conversion, increased size and cost. DVR topologies with direct ac-ac conversion can be used but these are very complex to control and still require several passive components for filtering purposes [14, 15].
Step Voltage Regulator (SVR)
Finally, step voltage regulators (SVRs) also provide a relatively straightforward means for voltage regulation. SVRs have been in operation for quite some time now and consist of a series compensation coil with mechanical switchable tapping points that are usually installed on feeders. The operation concept is shown in Figure 3.
The series coil is linked to a main shunt coil which is connected in parallel with the load [17, 18]. The main disadvantage of such SVRs is that they have mechanical moving parts and are slow to react to voltage changes. Albeit these disadvantages, in [19] it was shown that in certain cases SVRs could mitigate the low voltage problem during heavy load scenarios, as well as the overvoltage scenarios caused by high penetrations of photovoltaic systems.

Another disadvantage of SVRs is that similarly to OLTCs, these devices correct the three phases simultaneously and thus cannot operate correctly in cases of voltage unbalance. The solution to this would be to have decoupled individual phase voltage control as was proposed in [20].
»LVRSys®« Low-Voltage Regulation System
This paper presents a »LVRSys®« which does not require an OLTC to be present at the low voltage distribution transformer since it can carry out the function of the OLTC itself [22–24]. The advantage of this technology is that it can correct individual phases, has much faster reaction times, does not have moving parts and is very easy to retrofit on any type of transformer and feeder. The presented »LVRSys®« can also be designed to work at lower power ratings and can be installed even at mid-feeder [25]. The technology has been successfully implemented, is commercially available and has achieved widespread use in low voltage networks [26]. The »LVRSys®« is based on a very simple concept, that is, a transformer is used to add or subtract an ‘isolated’ stepped down version of the supply voltage at a specific point of the network. This technology requires a relatively simple control method and has very low power losses when compared with all other voltage regulation methods. The »LVRSys®« was found to be the most suitable technology for carrying out voltage corrective actions in the shortest time compared to alternative technologies. In this respect, the objectives of this paper are summarised below:
- The first objective is to develop a simulation model of the »LVRSys®« inMATLAB/Simulink using the PLECS block-set. This will be tested initially on a very basic low voltage feeder using aggregated load and a known voltage disturbance on one of the phases.
- Experimental data obtained from data logging carried out by the authors to monitor the performance of an »LVRSys®« deployed in a low voltage network feeder in Malta will be analysed.
- Finally, the data gathered from the previous analysis will be used to validate the simulation model of the LVR against the actual regulator. This simulation model will then be used for optimal selection of points on the low voltage network where such »LVRSys®« can be deployed to achieve the best performance.
The rest of the paper is structured as follows: In Section 2,a brief overview of the theory behind the voltage variation ona low voltage distribution network due to photovoltaic systemsand high load demand is given.
In Section 3, the concept behindthe operation of the »LVRSys®«, its typical deployment in the low voltage network and its control algorithm are reported.
The simulation model and the results obtained are discussed in Section 4. A case study of the »LVRSys®« is presented and discussed in Section 5. In Section 6, validation of the LVR simulation model is discussed and finally Section 7 concludes the paper.
2 VOLTAGE VARIATIONS ON A LOW VOLTAGE DISTRIBUTION FEEDER DUE TO PHOTOVOLTAIC INSTALLATIONS
2.1 Power flow along a low voltagedistribution feeder

A simplified single line diagram of a low voltage distributionnetwork from a distribution transformer (V1) to one endcustomer (V2) is shown in Figure 4. Assume that the customer has a load demand definedby PL+jQL and has a photovoltaic installation defined by PPV+jQPV.
In addition, let the impedance of the low voltagefeeder be represented by lumped impedance Z = (R+jX), thenat point V2, the apparent power and single-phase current can bedefined by:
S2 = V2 x I∗ = (PL−PPV) + j(QL−QPV) (1)
I∗ = (PL−PPV) + j(QL−QPV) / V2 (2)
The voltage drop across the low voltage feeder is given by:
ΔV = V1 − V2 (3)
I = V1 − V2 / Z = ΔV / Z (4)
ΔV = I∗ x Z = (PL−PPV)−j(QL−QPV) / V*2 x Z (5)
Assuming V2 is taken as the reference, V∗2 = V2 and substituting Z with R + jX , then (5) can be rewritten as shown below:
ΔV = ΔVd + jΔVq (6)
where ΔVd is the real part and ΔVq is the imaginary part of the voltage drop ΔV . For low voltage feeders, the X/R ratio is very low [20], hence the imaginary part can be assumed to be close to zero (ΔVq ≈ 0). Hence, (5) can be further simplified as:
ΔVd = V1 − V2 = (PL−PPV)R + (QL−QPV)X / V2 (7)
Equation (7) can be rewritten by making V2 subject of the formula:
V2 ≈ V1 − [(PL−PPV)R + (QL−QPV)X / V1] (8)
Equation (8) describes the behaviour of the voltage at the end of the feeder. Considering only the first term, if:
- PL > PPV, then V1 > V2: there is a voltage drop across the feeder impedance.
- PPV > PL, then V2 > V1: there is a voltage rise across the line impedance.
This means that when the customer’s load demand is higher than the photovoltaic generation, the voltage drops along the feeder’s impedance. On the other hand, when the photovoltaic generation exceeds the load demand, power flows towards the distribution transformer, which results in a voltage rise at the point of common coupling (PCC), of the customer. It must be pointed out that from (8), one can also conclude that even the net reactive power has a significant impact on the PCC voltage in cases where the inductance is significant. In fact, the reactive power control of photovoltaic inverters makes use of the inverter to inject/absorb reactive power to control the voltage magnitude [27]. However, currently in Malta, it is customary that the photovoltaic inverters are set to export power at unity power factor. Hence, in the analysis of this paper, the voltage shall be directly corrected irrespective of the state of reactive power of the system.
3 LOW VOLTAGE REGULATOR (»LVRSys®«)
3.1 Principle of operation

The LVR system (»LVRSys®«) discussed in this paper consists of a series regulator which is designed and manufactured by A. Eberle GmbH [28]. The voltage regulation takes place via the switching of the secondary side of a configuration of one or more fixed ratio transformers as shown in Figure 5.
Apart from the direct benefit of regulating the voltage at the installation position on the low voltage network, it has an indirect benefit of reducing the disconnection events of photovoltaic inverters due to high voltage at the PCC.
Hence, this also contributes towards the minimisation of intermittency of the energy generated from photovoltaic installations. The system corrects for voltage fluctuations on the electrical network by feeding an additional series voltage (e.g. 1.5% and 4.5% of the nominal voltage) through these transformers.
Based on the demand, the correction can have an increasing (in phase) or decreasing (out of phase) effect of up to ±6% in steps of ±1.5%.
The direction of voltage control (i.e. summation or subtraction of the percentage values) is determined by connecting the transformers primary winding through a thyristor bridge, controlled by an electronic controller.
Since the thyristor bank is used to switch the primary side of the compensation transformers, the current passing through them is very low when compared to the main current. This low current in the semiconductors results in a very small system power loss (below 0.5%).

3.2 Typischer Einsatz
The rated power of the »LVRSys®« can range from a few kVA up to MVA. They can be seamlessly attached to uncontrolled local grid transformers, busbars and multiple or single feeders as shown in Figure 6. Their power range and versatility allow them to be integrated in larger, more centralized positions as local grid regulators or smaller solutions dealing with single lines or even phases.
3.3 Funktionsprinzip des Algorithmus
As explained in Section 3.1, the regulator introduces step upor step-down compensation for the voltage along each singlephase of the supply line. In normal operation, the user sets twocontroller parameters as follows:
- Set point of the nominal voltage (e.g. 230 V)
- Tolerance band (dead band), either as a voltage magnitude oras percentage of the nominal voltage setpoint (e.g. ±3%).
This basic operation is shown pictorially in Figure 7.When the input supply voltage deviates outside the toleranceband, the controller determines the required voltage compensationvalue and triggers the necessary thyristors to switch the required transformers combination.


Typical combinationoptions for a ±6% compensation range are shown in Table 1. In cases where no contribution is needed by any of the transformers(denoted by 0%), the transformer primary winding isshort-circuited. Similarly, if the supply voltage is within the toleranceband, the »LVRSys®« will remain inactive with both transformers’primary side short-circuited.
The reaction time of the »LVRSys®« can also be set by the userin terms of Volt-seconds (V s). The fastest time to react to avoltage deviation is below 30 ms, and the system can be madeslower from 1 to 100 V s in steps of 0.1 V s. The voltage regulator can also regulate the voltage at a distant node if the grid impedance (Zgrid) upstream to this node is known. In such cases, the set-point voltage can be determined by:
Vset _point = Vmeasured + Imeasured × Zgrid (9)
where Vmeasured and Imeasured are the voltage and current quantitiesmeasured by the system.
3.4 Anwendung auf Photovoltaikanlagen und große Lasten
Consumer and prosumer energy profiles exhibit daily fluctuations. During periods of high solar irradiance, photovoltaic systems can produce more energy than that required by the loads, causing the voltage to rise on the feeder.
Conversely, in the evening as the load demand increases, voltage drops occurs on the feeder without the aid of the photovoltaic generation. The »LVRSys®« can cater for both case scenarios as shown in Figure 8.
In both cases, the voltage deviations might be too large, leading to the voltage to vary beyond the limits set in the EN50160:2010 standard [2]. This shows that the voltage regulator is equally suited to facilitate both the integration of distributed generation, as well as to mitigate the predicted increase in loads due to the wide-spread of EV charging infrastructure.

4 SIMULATION MODEL OF THE LOW VOLTAGE REGULATOR
4.1 Simulation model
A simulation model of a single-phase LVR was developed in MATLAB/Simulink using the PLECS blockset. The voltage regulator model consisted of two anti-parallel thyristor-based h-bridges as shown in Figure 5, a controller and two transformers. Another set of anti-parallel thyristors was also added across the primary windings of the transformer to short-circuit the windings when the voltage is within the dead band region.

The compensation transformers were chosen to achieve compensation levels of 2.5%×Un and 7.5%×Un, resulting in a combination that can compensate over a range of ±10%×Un. A simple distribution system model was also modelled to test the »LVRSys®«. It consisted of a Dyn11 distribution transformer (11 kV/400 V), a 100 m aluminium feeder with a lumped impedance of 0.211 + j0.072Ω/km and an aggregated load of 30 single phase households modelled by a lumped impedance of 1 + j0.754Ω on each phase. The simplified representation of the low voltage feeder and the voltage regulator models is shown in Figure 9.
The main objective of the LVR controller was to determine the required voltage compensation and then switch on the necessary combinations of thyristors’ accordingly. The inputs to the controller are user defined setpoints: nominal voltage (VNOM) and the dead band, and measurements (current and voltage). The controller measures the current (INOM) through the regulator (i.e. load current) and the voltage on »LVRSys®« output (i.e. regulated load voltage). The current measurements were required to determine the phase information and switch on the thyristors at zero-crossings. The voltage measurement was required by the algorithm so as to track the performance of the voltage regulator.
4.2 Simulation results
A disturbance voltage was introduced on phase C of the transformersecondary winding, as an initial test of the performanceof the »LVRSys®«. The disturbance consisted of a ramp variationof the series injected voltage between 25 V and −25 V rms.The nominal voltage setpoint was set to 230 V rms and thedead band to ±5 V. Simulations were carried for a period of10 min and the results are shown in Figure 10.
As can beobserved from the waveforms, initially the uncorrected voltagewas within the tolerance region (dead band) and hence the »LVRSys®« was inactive. During the period between t = 40 s and t = 60s, the voltage started to drop according to the negative rampdisturbance.
As soon as the phase voltage reached the lowerdead band value, the »LVRSys®« corrected the voltage by introducingthe first compensation of +2.5% (Step 1 in the inset ofFigure 10). The uncorrected voltage kept reducing and the regulatedvoltage exceeded again the lower dead band limit.

The controller increased its compensation to +5% by switch on the 7.5% and 2.5% compensation transformers in series aiding and series opposing respectively (Step 2 in the inset). This procedure was repeated (steps 3 and 4) until all +10% compensation was achieved. At t = 150 s, the magnitude of the voltage started its recovery towards the nominal voltage and the controller started relaxing its compensation level until all compensation was removed. At t = 400 s the network voltage started increasing and exceeded the upper dead band. The controller repeated the same procedure as above however this time with negative compensation.
5 CASE STUDY OF »LVRSys®« IN THEMALTESE LOW VOLTAGE NETWORK

A case study was conducted on a very long feeder cable in a semi-rural area in Malta on which consumers were experiencing both over and under voltages.
The geographical information system (GIS) of the distribution network has been provided by Enemalta plc. From the GIS, the location of the low voltage feeder mid-point was identified.
The information obtained from the GIS was then used as a starting point of an onsite survey to identify potential (physical) locations that can accommodate the »LVRSys®«.
The survey considered the nodes between the midpoint and the end-point of the low voltage feeder. A strategic location that could potentially accommodate an »LVRSys®« was identified at 70% of the feeder length. A voltage monitoring exercise was conducted for a week at the identified location. The number of consumers/prosumers and their supply type connected downstream of the voltage monitoring point are tabulated in Table 2. The load current profile of the feeder is shown in Figure 11. The total capacity of installed photovoltaic systems was estimated at 30 kWp. The position of the logging exercise was at approximately 70% of the feeder length (as previously identified). The uncorrected three phase voltage profile measurements (Brown, Black, Grey) and the allowable ±10% nominal voltage variation limits (Red) are shown in Figure 12.


As can be observed from the voltage profiles, the voltage approached the upper allowable limit every day at around 12:00 PM whilst it went below the lower limit at around 08:30 PM. The most problematic phase was Phase C (grey waveform). This information coincided with the periods during maximum photovoltaic generation and highest loading respectively.
Since this measurement was taken at 70% of the feeder length, it was expected that the voltage variations for consumers connected towards the end of the feeder were even more significant.
A low voltage regulator system with the parameters listed in Table 3 was installed at the identified location (approximately 70% of the feeder length) to compensate for voltage rises and drops during photovoltaic generation and high load periods respectively.


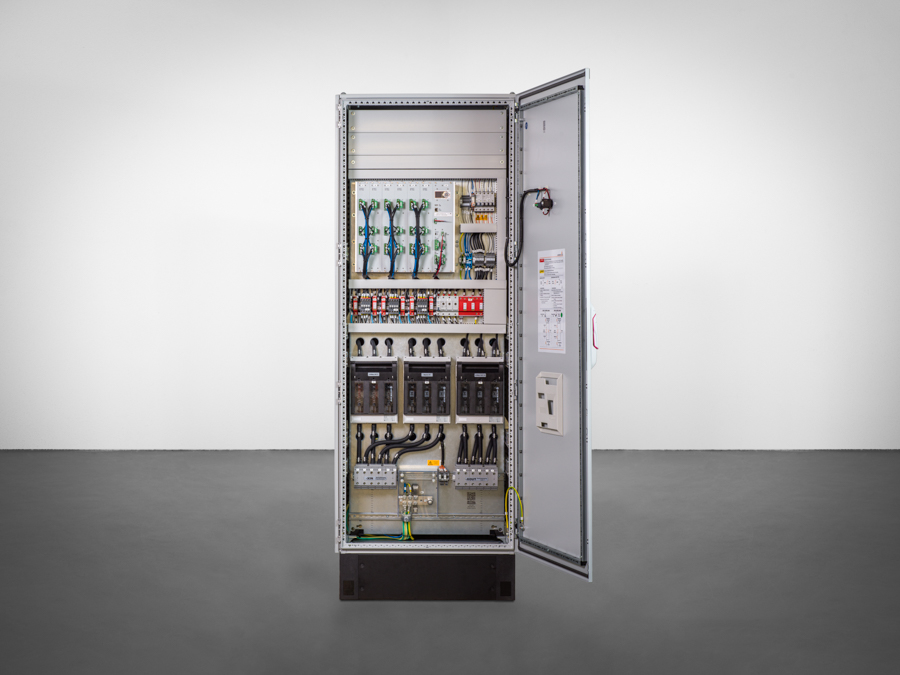
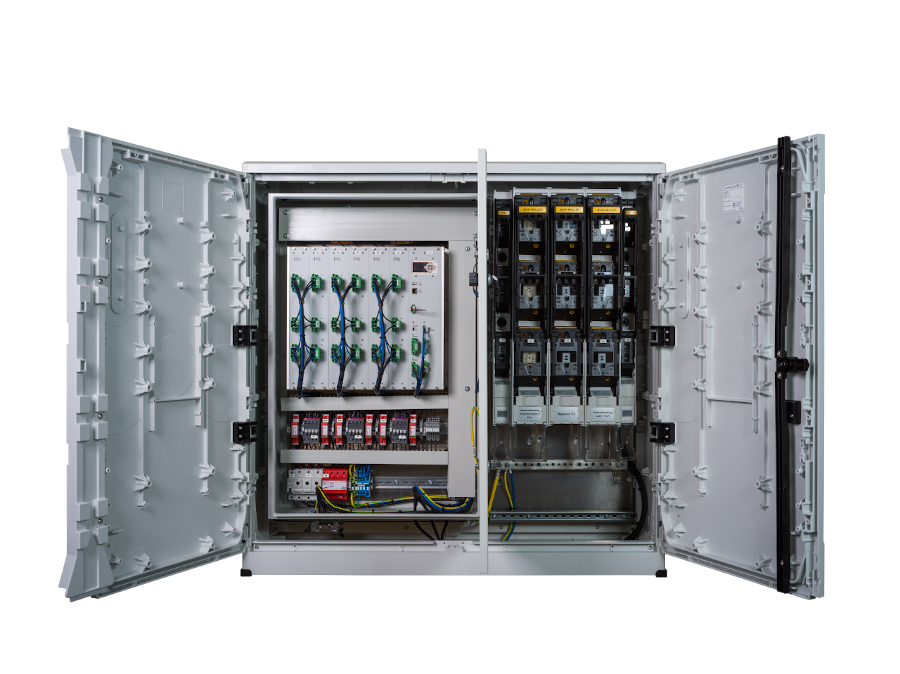
The installed equipment is shown in Figure 13. Since the feeder was observed to predominantly suffer from large voltage drops rather than voltage rises, the nominal voltage setpoint was set to 240 V.
The voltage profile obtained on the load side of the low voltage regulator system is shown in Figure 14.
It can be observed that the voltage on the three phases was controlled successfully for most of the time close to the programmed nominal voltage setpoint. The voltage rises were completely compensated for and a headroom of approximately 10 V rms to reach the maximum allowable limit can be observed.
This means that other additional photovoltaic systems can be integrated without violating the operational limits.
With respect to the voltage drops, it can be observed that in most of the cases the »LVRSys®« managed to correct for drops. However, there is one instant were the system failed to successfully compensate for this that occurred on the 25th of July, 2022. This occurred since the voltage dropped to a very low value of 184 V (−23.3%) and the maximum regulation range of the installed system was only of ±10%. Table 4 illustrates the min/max rms voltages before and after compensation on Phase C.


6 LOW VOLTAGE REGULATOR: SIMULATION MODEL VALIDATION
The information gathered from the field testing of the LVR was used to carried out the validation of the developed regulator model, shown previously in Figure 9.
Voltage data obtained from one of the phases of the uncorrected three phase voltages was then used as the input voltage to the low voltage model.
The user-defined settings of the model were then set to match those of the installed »LVRSys®«, that is, the nominal voltage was set to 240 V and the dead band to ±3 V.
The results obtained for a dataset covering a period of 1 week are shown in Figure 15.


A zoomed plot showing the results obtained for one of the monitored days (26/07/2022) is shown in Figure 16.
The corrected voltage from the field data (Figure 14—Phase C) and the simulation model (Figure 15—orange waveform) show that the simulation model managed to achieve identical results.
The results show that the simulation’s waveforms follow very accurately those obtained in a practical field-tested »LVRSys®«.
This confirms that the model is a true and correct representation of the low voltage hardware equipment. The simulation carried out considered the application of one piece of equipment on a feeder.
However, since the »LVRSys®« model has been proved to work correctly, it can now be used in larger and more complex low voltage network simulations.
7 CONCLUSION
This paper reviewed common methods that are used to mitigatevoltage variations in low voltage networks due to high photovoltaic generation as well as high load demands. A simulation model of an »LVRSys®« was developed in MATLAB/Simulink using the PLECS blockset. A case study carried out on a low voltage feeder in a semi-rural area in Malta was then presented. The feeder was originally designed to cater for a small community and was not designed to accommodate large photovoltaic systems and EVs. A voltage profile at 70% of the feeder was presented were several instances of over and under voltage problems were observed. A »LVRSys®« was installed that can potentially alleviate both the over and under voltage problems.
The results show that the voltage on the load was successfully regulated around a nominal voltage of 240 V. The only instances where the regulator failed to correct the voltage to within ±10% was during a very high load case. In this case, the voltage dropped so low that it exceeded the regulation range of the system. However, the device still managed to correct the voltage from 184 to 200 V. The real-time data of the uncorrected voltage gathered from this case study was then used to validate the simulation model developed for the »LVRSys®«. The results obtained from the simulation model agreed with the real-time data of the corrected voltage. It can be concluded that the developed »LVRSys®« simulation model performs almost identically to the actual equipment. Hence, the developed »LVRSys®« simulation model can be used to:
- study the behaviour of more complex low voltage networks with the integration of »LVRSys®«,
- identify the optimal location of the »LVRSys®« before the actual deployment,
- assess the amount of additional photovoltaic systems that can be integrated on the network and predict the voltage variation in problematic areas of the network.
AUTHORS
John Licari: Conceptualization; data curation; formal analysis; investigation; methodology; resources; software; validation; visualization; writing—original draft.
Cyril Spiteri Staines: Conceptualization; data curation; formal analysis; investigation; methodology; resources; software; validation; visualization; writing—original draft.
Alexander Micallef: Conceptualization; data curation; formal analysis; investigation; methodology; resources; software; validation; visualization; writing—original draft.
Stefan Hoppert: Conceptualization; writing—review and editing
ACKNOWLEDGEMENTS
This research was funded by the Energy and Water Agency under the National Strategy for Research and Innovation in Energy and Water (2021-2030), grant agreement number REVOLT EWA 65/22. The authors would also like to thank the Maltese Distribution System Operator (DSO/VNB) “Enemalta plc” (DSO) for providing access to the »LVRSys®« and the data required to conduct this study.