What is Power Quality
Good power quality is characterized by the fact that the mains voltage actually arriving at the consumer matches the mains voltage promised by the utility company. Various factors have an influence on power quality:
- Power generators and the structure of the distribution network of the power company
- Transmission of the mains voltage
- Influences of the consumer
The reliability of supply depends on the extent to which an electrical distribution network fulfills its supply tasks within a specific period of time. Modern measurement technology such as our mobile or fix-installed power quality analyzers makes an important contribution to ensuring power quality in the low-voltage network.
Without them, neither a statement about the quality of the individual characteristics of the voltage, nor the cause of disturbances could be detected.
Ensuring power quality at the transfer point is precisely regulated in various standards (DIN EN 50160, VDE-AR-N 4120, IEC 61400-21, etc.) for the generation and consumption of the electricity as well as for the distribution grid and it forms the basis of the grid connection contract. Power quality measuring devices are required to determine harmonic levels and the THD factor (Total Harmonic Distortion Factor). They determine the electrical power quality parameters from the measured voltage and current signals. Furthermore, these devices can be very helpful during a fault analysis. They are able to identify harmonics that have a disturbing effect on electronic components which can significantly shorten their service life.
Evaluation Criterias for Power Quality
Causes and consequences of poor power quality
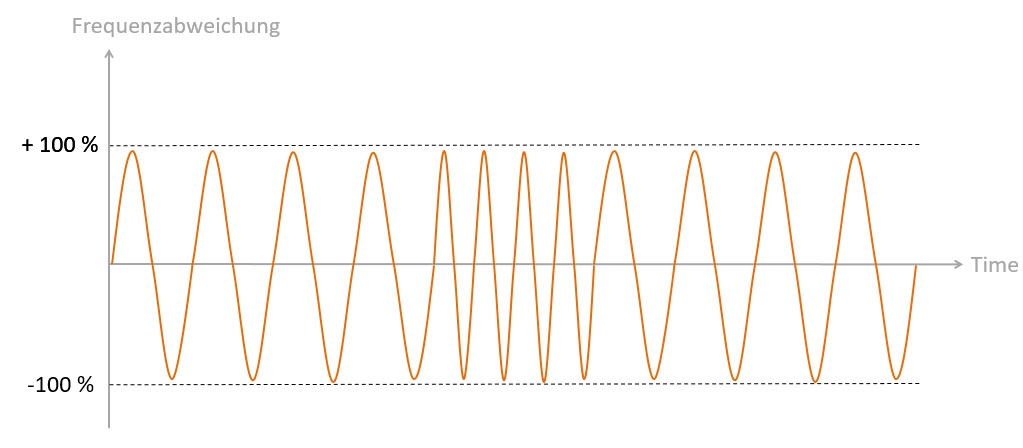
Frequency Deviation
The evaluation of frequency deviation events is based on the 10s average values of the network frequency. The limits of the permitted frequency deviation distinguish between synchronous networks (±1 % = 0.5 Hz) and islanded networks (±2 % = 1 Hz).
Causes of large frequency deviations are sudden disconnections of large loads or generation plants. Excessive frequency deviation can lead to loss of synchronism of motors and generators and thus damage them.
Voltage Dip
Temporary drop in the effective value of the voltage below a specified initial dip threshold at a specific point in the electric utility grid. The voltage dip can be caused by the connection of loads.
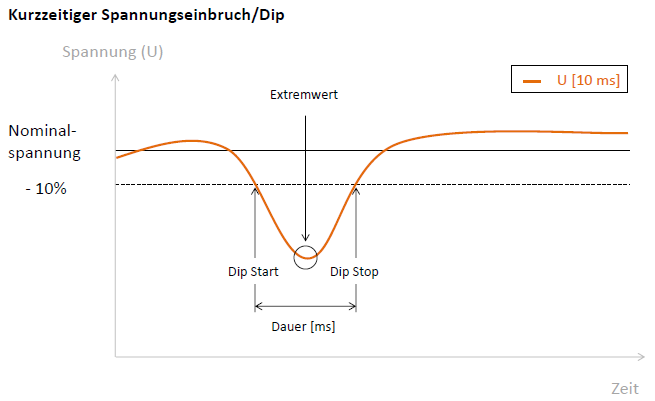
Erklärung der Begriffe:
Extremwert: Tiefster Wert der 10ms-Spannung während des Ereignisses [V]
Dauer: Zeitunterschied zwischen Verlassen und Wiederkehr in den Nennbereich der Spannung [ms]
Voltage Swell
Temporary increase in the RMS value of voltage above a specified initial threshold at a particular point in the electric utility grid. The voltage swell can be caused by the disconnection of loads.
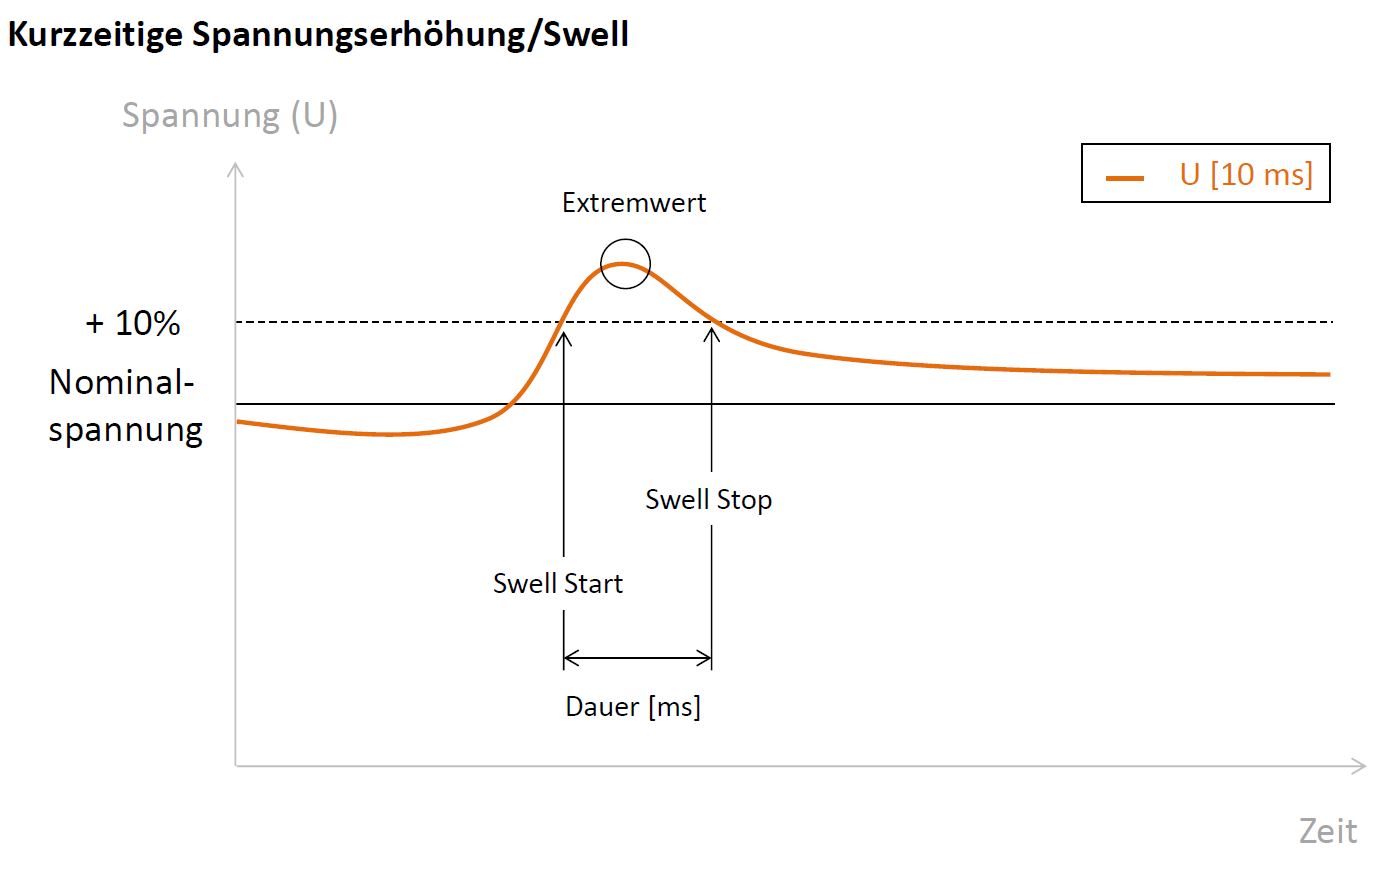
Erklärung der Begriffe:
Extremwert: Größter Wert der 10ms-Spannung während des Ereignisses [V]
Dauer: Zeitunterschied zwischen Verlassen und Wiederkehr in den Nennbereich der Spannung [ms]
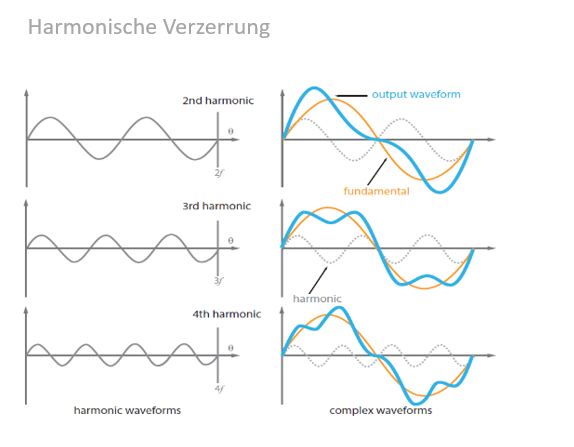
Total Harmonic Distortion (THD) / Harmonics
The ratio of the sum of all harmonic rms values to the rms value of the fundamental. The value of THD indicates the total distortion due to non-linear loads.
Causes:
Due to nonlinear loads in the utility grid, distortion of the sinusoidal shape of the voltage in the grid can occur. Depending on the type of load, certain multiples of the grid frequency (harmonics) become particularly pronounced. For example, three-phase loads, such as synchronous/asynchronous motors or B6 rectifiers, experience particularly strong distortions of the 5th and 7th and 11th and 13th harmonics. For low-voltage single-phase loads, the multiples of 3 are often affected (15th, 21st, 27th). A distortion of a harmonic is recorded as a PQ event if the 10min average of the magnitude is above the limit defined by the standard. In the PQ event, the order of the harmonic as well as the exceeding of the limit are indicated in [%]. Excessively high levels of voltage harmonics can lead to malfunction, overheating and failure of electrical equipment as well as increased noise.
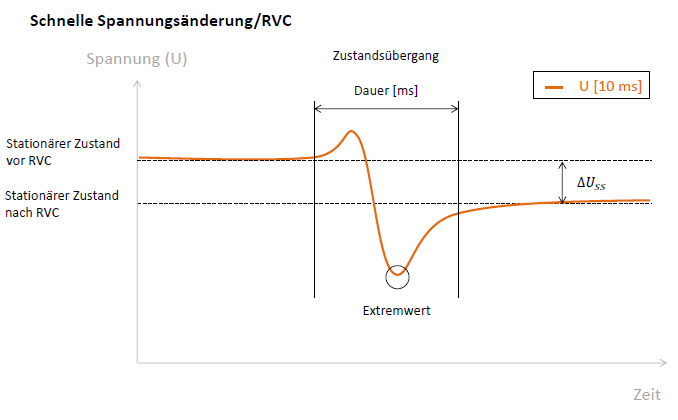
Rapid Voltage Change (RVC)
Rapid voltage change occurs relatively frequently in the electric utility grid and is mainly caused by load changes in customer facilities and switching operations in the grid. The power quality event of rapid voltage change is characterized by the grid voltage transitioning from one steady state to another steady state.
The duration of the transition, the maximum voltage deviation during the transition, and the steady-state change in voltage are recorded in the event. Rapid voltage changes usually do not have a large impact on electrical equipment. However, frequent RVC events can lead to the increase of the flicker level.
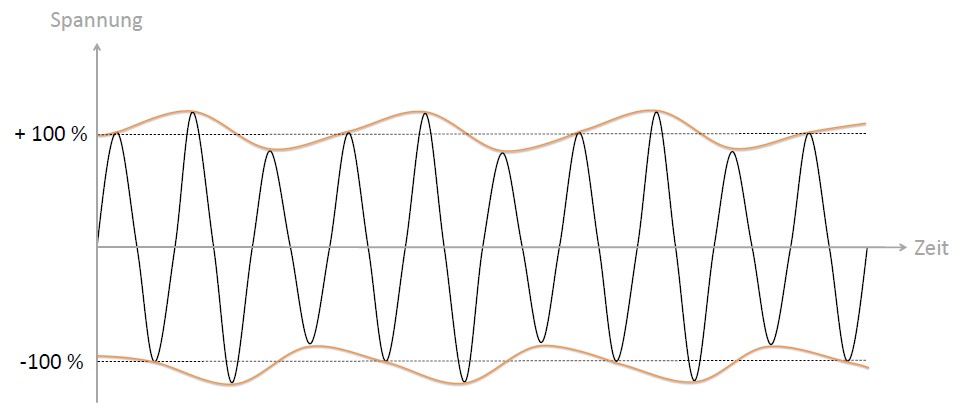
Flicker
Flicker is a measure of the strength of periodic voltage fluctuations in the electrical network, which lead to a visually perceptible change in the luminance of electrical lamps. Using the flicker measurement method according to DIN EN 61000-4-15, these fluctuations are calculated as a dimensionless quantity and averaged over two time intervals using a weighted average method. The short-term flicker Pst (perceptibility short-term) is formed in the 10 minutes interval, the long-term flicker Plt (perceptibility long-term) in the 2h measuring interval.
Causes:
Causes for an increased flicker value are mostly periodic power fluctuations in the network with high network impedance (weak grid). Furthermore, high harmonic currents and interference between loads can cause the flicker limit to be exceeded. Power quality events such as momentary overvoltages or undervoltages (swell/dip) also very often violate the flicker limit of the affected voltages. In this case, the flicker events can be ignored.
Meaning for EN 50160 evaluation:
In the EN 50160 standard there are no limits for the number of Pst and Plt events. Only the weekly statistics of the long-term flicker Plt in the 2h interval is evaluated.
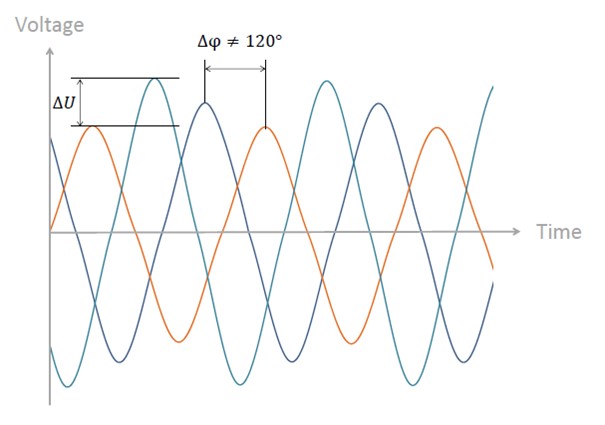
Voltage Unbalance
Voltage unbalance is a measure of the uneven loading of a three-phase system. This can be noticeable by different amplitudes ΔU of the individual phases or a phase angle difference Δϕ unequal to 120° between the phase-to-phase voltages. To calculate the voltage unbalance, the 10 min average values of the symmetrical components of the measured voltage system are used. The value for the unbalance [%] is calculated from the ratio of the negative sequence to the positive sequence.
Causes:
Problems with the symmetry of the three-phase system occur mainly in low-voltage grids and are caused by unevenly distributed single- and two-phase loads as well as generation plants. In medium and high voltage grids, unbalances can be caused by melting furnaces or twisted transmission lines.
Significance for EN 50160 evaluation:
In the EN 50160 standard, there are no limit values for the number of voltage unbalance events. Only the weekly statistics of the voltage unbalance measured values in the 10-min interval are evaluated. The limit value is usually 2%.
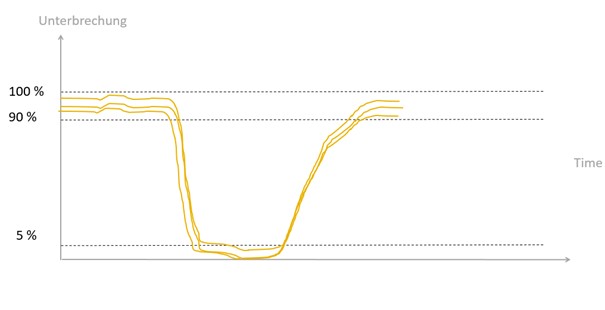
Power Supply Interruption
A power supply interruption is characterized by the voltage on all phases dropping to less than 5% of the nominal value. A distinction is made between scheduled or unscheduled interruptions of the supply in a given area, short-term interruptions (up to 3 minutes) and long interruptions (more than 3 minutes). Causes of interruptions can be external influences such as damage to transmission lines due to natural events or planned switching operations or circuit breaker response.
Our Special Application Series (videos in German only):
Current issues about Power Quality
Changes in Energy Technology – Part 1
In this article, which we created together with the web portal Schutztechnik.com, we discuss the current changes in the energy technology. In addition, we will look on the effects of grid repercussions and what influence they have on measuring devices with which we detect faults in the grid.
Changes in Energy Technology – Part 2
Standards play a major role for power quality measurements. Accordingly, it is essential that these standards are also adapted to the new conditions in the course of the change in energy technology. In the second article of our series, we look at the current standards and how they should be interpreted with regard to high switching frequencies.
Power Quality Measurements:
The N-Conductor & Harmonics
In power quality measurements, odd harmonics such as the 15th, 21st & 27th are often violated. What are harmonics anyway, how does this circumstance occur and what influence does this have on the neutral conductor. This article deals with these questions and sheds light on this matter.
Power Quality Measurements:
The 3. Harmonic
The report “The N conductor & Harmonics” already explained the special features of the The report “The N conductor & Harmonics” already explained the special features of the harmonics divisible by 3 and why they add up on the neutral conductor. This special publication intends to illustrate a typical power quality measurement and the aspects, which should be taken into consideration conducting the measurements. The measurements displayed in this report took place in an office building where increasing problems with the power quality were detected.
Our Mobile Power Quality Analyzers
The PQ-Box family consists of powerful, portable network and frequency analyzers, power measurement devices and transient recorders. During their development, user-friendliness and practical considerations were the key concern.
More Information
Special Publications
Applications of our devices

Experimental Validation of a Low-Voltage Regulator Model – Case Study of a Maltese Low-Voltage Grid
This application report addresses the integration of the »LVRSys® Low-Voltage Regulation System« into the low-voltage grid in Malta.
Read more
Cost Efficient Management of Digital Secondary Substations: Earth Fault Indicator EOR-3DS as Digitisation Unit for Secondary Substations
Digital secondary substations are becoming a key element for distribution system operators in terms of automation, monitoring, and efficient operations of their networks. Read this technical report about the EOR-3DS in its role as digitisation unit for secondary substations.
Read more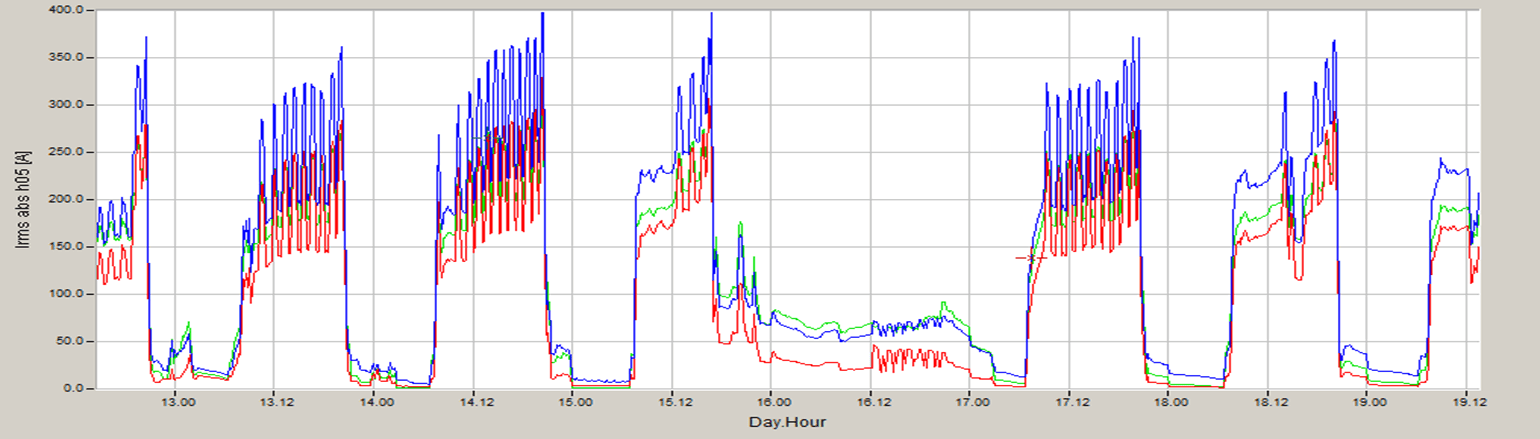
Ferrari´s Meter vs. Electronic Meter
This technical report analyzes a power measurement at a large industrial customer. The customer records very high currents and fifth harmonic voltages during production time, which leads to poor voltage quality.
Read more
Angle determination of voltage and current harmonics in practice
Today’s devices and equipment such as switched-mode power supplies, frequency converters, regulated drives, charging devices for e-mobiles or LED lighting work internally with high clock frequencies in order to regulate power efficiently. These can lead to both conducted and field-bound (coupled) influences in the energy grid. In this technical report, we explain how you can detect these sources of interference in the grid using suitable measuring technology.
Read moreOur fix-installed Power Quality Devices
The built-in fault recorders and network power quality analyzers are the central components in systems handling all measurement tasks in low, medium and high-voltage networks.
More Information
Improtant Norms for Power Quality
An overview
We summarize the most commonly used international norms relating to Power Quality. In order to evaluate power quality at a particular measurement point, it is important to consider the standards that apply to that particular network. As shown in the table, some standards apply to specific voltage levels. In most cases, low voltage is defined as < 1 kV, medium voltage from 1 to 35 kV, and high voltage > 35 kV.
EN 50160
Description: Characteristics of voltage in public electricity supply networks
Applies for: Low, medium and high voltage (public European grids)
Surveryed quantities:
- Frequency
- Voltage
- Flicker
- Frequency, Voltage, Flicker,
Harmonics of voltageHarmonics of voltage
IEC 61000-2-2
Description: Electromagnetic compatibility in public grids
Applies for: Low voltage public grids
Surveryed quantities:
- Frequency
- Voltage
- Flicker
- Harmonics of voltage
- Frequency bands of harmonics up to 150 kHz
IEC 61000-2-12
Description: Environment – Compatibility levels for low frequency conducted disturbances and signalling in public medium-voltage power supply systems
Applies for: Low voltage public grids (International)
Surveryed quantities:
IEC 61000-2-4
Description: Electromagnetic compatibility for line-bound disturbances
Applies for: Low voltage industrial grids (International)
Surveryed quantities:
- Frequency
- Voltage
- Flicker
- Harmonics of voltage
IEEE 519
Description: Recommended Practice and Requirements for Harmonic Control in Electric Power Systems
Applies for: Low, medium and high voltage industrial grids (International)
Surveryed quantities:
- Harmonics of voltage and current
IEC 61000-3-12
Description: Limits of current harmonics for loads with line current > 16 A and < 75 A
Applies for: Low voltage public grids
Surveryed quantities:
- Harmonics of current
Power Quality Services
We offer network analyses according to EN 50160 and IEC 61000-2-2, -2-4, -2-12 and support you with our expertise and our well-equipped device lending pool including all necessary measurement accessories. After the network analysis, we will develop a solution with you based on the measurement data and evaluation.
More Information