Electrical power grids are technical systems with many interacting contributors such as energy loads, generators, storage systems or compensation equipment. These devices are all somehow connected and therefore they need to work in a way that they do not negatively affect other devices in an inadmissible manner.
Nowadays more and more classical energy consumers like synchronous machines are replaced by variable frequency drives that provide higher efficiency and variability but cause new problems in higher frequency ranges.
In order to regulate the disturbance emissions of this variety of loads, several grid norms (e.g. EN 50160, IEC 61000-2-2, IEEE-519,…) have been established over the years. The following report displays the interaction of a PQ-Box and the WinPQ mobil software which are used to conduct an evaluation of the disturbance levels at a measuring point according to current grid norms.
Overview of all applicable grid norms for Power Quality
The following table provides an overview of the most commonly used international grid norms. In order to evaluate the power quality at a specific measurement point, it is important to consider the norms that apply to the measured grid. As you can see in the table, some norms apply to specific voltage levels. In most cases, low voltage is considered to be < 1 kV bus voltage, medium voltage from 1 kV to 35 kV and high voltage > 35 kV.
Grid types with different voltage levels do have different characteristics which results in different threshold levels and requirements for the measurement evaluation. Some norms are explicitly designed for a specific voltage range. Common norms such as the EN 50160 and the IEC 61000-2-2 try to cover a wide range of electrical parameters for electrical grids e.g. Frequency, Voltage Levels, Flicker, Voltage Harmonics & THD. They show from the view of the energy supplier what level of power quality a customer at a connection point can expect. Other norms, that are more specific like the IEC 61000-3-12 are only used for the evaluation of current harmonics and relate to the requirements that new loads have to fulfil before they are allowed to be connected to an electrical power system.
The correct norm to use for a measuring point always depends on the nature of the power quality problem. A general investigation requires a universal norm. If there is a specific problem in high-frequency interference, it makes sense to go for a specific norm such as the IEC 61000-2-2.
EN 50160
Description: Characteristics of voltage in public electricity supply networks
Applies for: Low, medium and high voltage (public European grids)
Surveryed quantities:
- Frequency
- Voltage
- Flicker
- Frequency, Voltage, Flicker,
Harmonics of voltageHarmonics of voltage
IEC 61000-2-2
Description: Electromagnetic compatibility in public grids
Applies for: Low voltage public grids
Surveryed quantities:
- Frequency
- Voltage
- Flicker
- Harmonics of voltage
- Frequency bands of harmonics up to 150 kHz
IEC 61000-2-12
Description: Environment – Compatibility levels for low frequency conducted disturbances and signalling in public medium-voltage power supply systems
Applies for: Low voltage public grids (International)
Surveryed quantities:
IEC 61000-2-4
Description: Electromagnetic compatibility for line-bound disturbances
Applies for: Low voltage industrial grids (International)
Surveryed quantities:
- Frequency
- Voltage
- Flicker
- Harmonics of voltage
IEEE 519
Description: Recommended Practice and Requirements for Harmonic Control in Electric Power Systems
Applies for: Low, medium and high voltage industrial grids (International)
Surveryed quantities:
- Harmonics of voltage and current
IEC 61000-3-12
Description: Limits of current harmonics for loads with line current > 16 A and < 75 A
Applies for: Low voltage public grids
Surveryed quantities:
- Harmonics of current
Requirements on the measurement method
In order to deliver reliable results, all grid norms demand specific measurement methods from the measuring device. These methods are:
- IEC 61000-4-30: This norm could be labelled as the most important one and describes the general parameters of a “Class A” measuring device such as accuracy, aggregation method and important measurement parameters.
- IEC 61000-4-15: The norm describes the measurement of Flicker.
- IEC 61000-4-7: The norm defines the procedures for the measurement of harmonics and frequency bands up to 9 kHz of voltage and current.
All of our PQ-Boxes comply 100 % with these norms and can therefore be used for the evaluation of all commonly used power quality norms all over the world.
Setup of PQ-Box
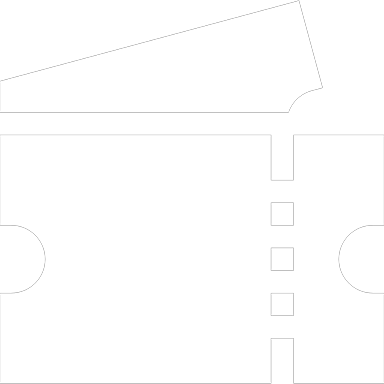
The proper setup of the measurement device is the most important task before starting an investigation, because there are so many parameters described in different grid norms. In order to allow a quick and easy setup with the best results for the customer, the free software WinPQ mobil comes along with a complete parameter set of the most common power quality norms. Our experts continuously maintain the threshold values. Changes of compatibility levels are updated automatically.
The grid norm templates can be uploaded to any PQ-Box as seen in Figure 1. It is easily possible to customize the parameters and create your own templates based on our choice of parameters.
Therefore, you can change the measuring interval or adjust the nominal voltage or CT and VT ratio to the required values. While other power quality meters require the recorded measurement values to be defined before the measurement, the PQ-Box simply records all possible power quality-related voltage and current measures as well as power and energy values.
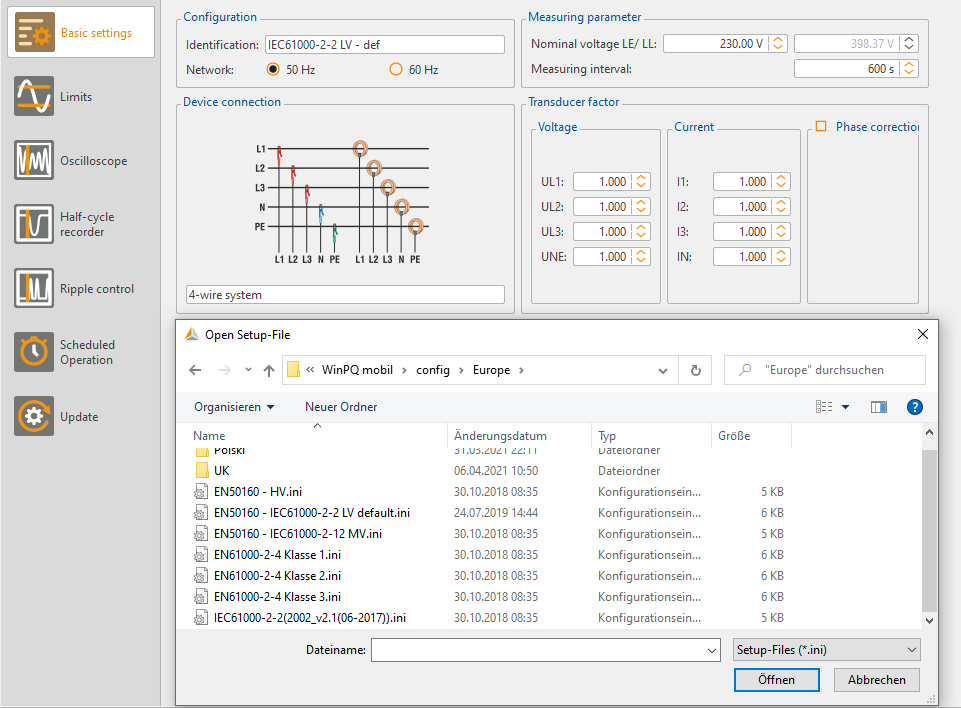
The recording of harmonics depends on the selected grid type (see Figure 2). In a 4-wire system, the voltage harmonics will be stored as line-to-neutral values. In a 3-wire system, harmonics will be stored line-to-line. Medium and high voltage grids usual-ly run in 3-wire mode. In low voltage, the standard is a 4-wire (TN-C), but in some industrial applications, it is possible to face isolated delta systems. For the evaluation according to the IEEE 519 norm, it is possible to activate further recording in a 3 sec interval in addition to the standard measurement interval.
Connection at the measurement point
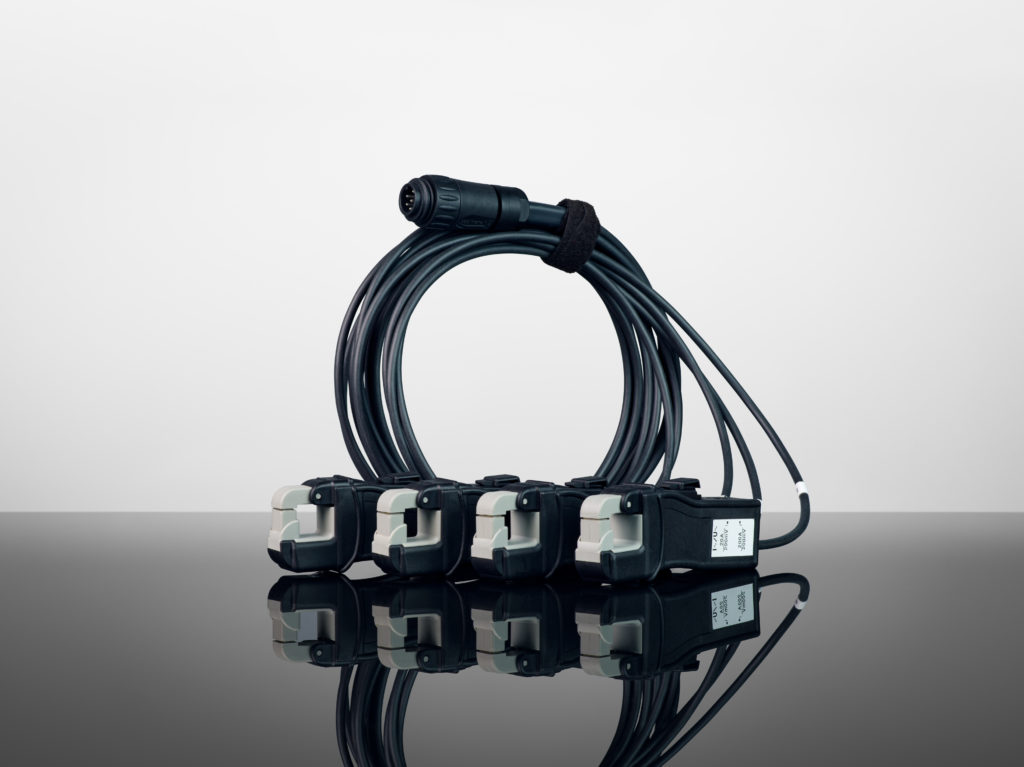
For the connection at the measuring point, PQ-Boxes are offering a variety of current measurement equipment. Our PQ-Boxes detect the type of equipment automatically whereby the user does not need to change the settings.
When measuring at the secondary side of CTs, we recommend using mini current clamps. The transducer factor of the external CT has to be set in the general settings of the device. The voltage leads of the PQ-Box can be connected directly to the bus bar (< 1000 V) or the secondary side of VT using the included dolphin or magnetic voltage probes. The recording starts via pressing the “play” button on the PQ-Box or via the WinPQ mobil software.
Data evaluation
Levels of distortion in transmission and distribution systems vary according to loading over (1) a 24-hour period and (2) between weekdays and weekends. This is why all power quality norms require a statistical analysis of the recorded data in specific time windows. The most common evaluation interval is at least 7 days or its multiples with a measuring interval of 10 minutes.
Grid norms with shorter aggregation intervals like e.g. IEEE-519 require a daily statistical evaluation of 3 sec values. In many cases, it will not be possible to start and stop the PQ-Box at a specific time, so it makes sense to start the measurement a little bit before the desired start of the investigation period and stop the measurement after the end of the period. When loading the data file with the WinPQ mobil software, it is possible to select a dedicated evaluation time window of 1 day, 1 week, etc.
The following screenshot in figure 3 on the left shows the startup screen of a measurement with a total length of 8 days and 22 hours. By pressing the button at the bottom, it is possible to select an interval of exactly 7 days. The starting time of the interval can be freely selected.
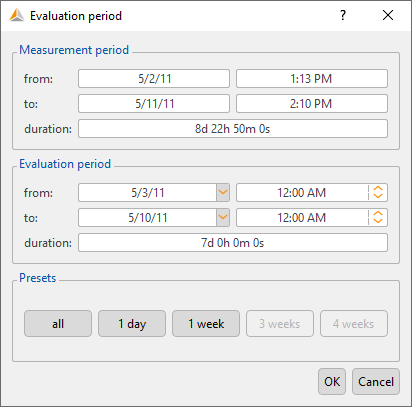
The screenshot on the left shows the startup screen of a measurement with a total length of 8 days and 22 hours. By pressing the button at the bottom, it is possible to select an interval of exactly 7 days. The starting time of the interval can be freely selected.
After loading a measurement, WinPQ software provides a number of automatic norm evaluation options:
- Generate automatic report according to EN 50160, IEC 61000-2-2 or IEC 61000-2-4
- Generate voltage harmonics report
- Generate current harmonics report
The automatic report function is very useful for power standard evaluation. By one click, it generates a printable PDF report that evaluates the following Power Quality parameters:
- Frequency
- Voltage changes
- THD
- Harmonics
- Unbalanced voltage
- Ripple control voltage
Examples
Measurement at a PV plant in a low voltage grid
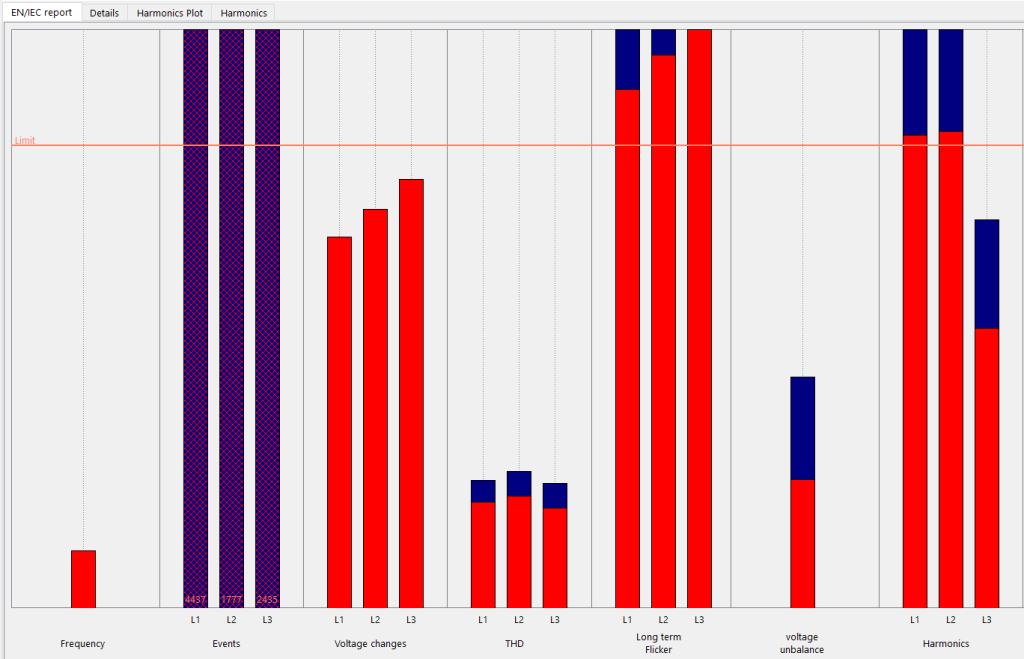
Figure 3 shows a measurement with the PQ-Box 100 at a PV plant (about 15 kW) in a remote area. After the installation of the plant at a farmer’s house, the residents complained to the grid operator about flickering lights. The low voltage grid has a nominal voltage of 230 V (line-to-neutral) and is designed as a TN-C system. In order to compare the power quality with grid norm EN 50160, a measurement for 7 days has been made. The voltage limits of this norm are at – 10 % (207 V) and + 10 % (253 V). A quick evaluation with the WinPQ mobil (Figure 3) shows the following situation:
- A lot of power quality events (short term 10ms violations of voltage limits)
- Voltage changes are close to the limit
- Flicker values above the limit
- Limit violation of voltage harmonics
Evaluation of harmonics
Having a closer look at the details of the voltage harmonic analysis (Figure 4) shows that all significant harmonics such as 5, 7, 11, 13 are far below the limit value.
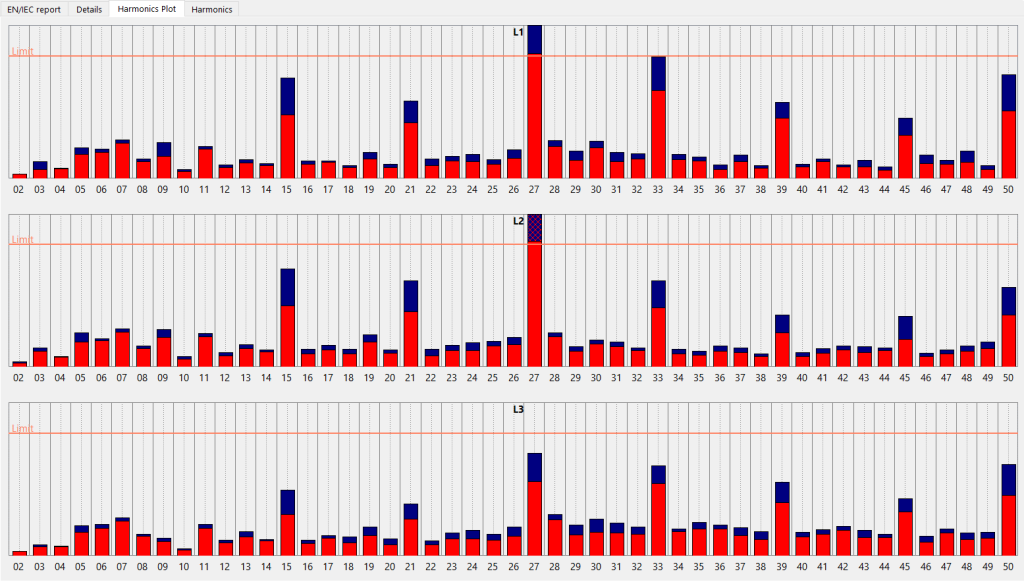
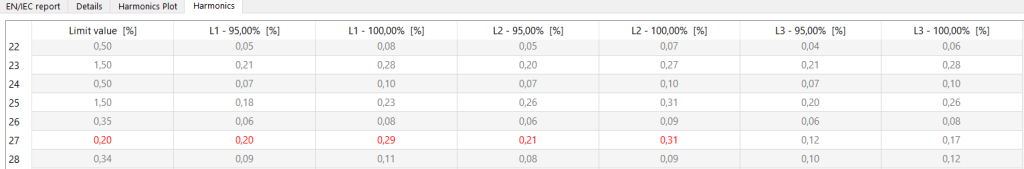
Note: The red and blue bars visualize the statistical evaluation of the norm. The red bar stands for the 95 % percentile (99 % in medium and high voltage) and the blue bar for the maximum value of all analysed values.
Only the harmonic 27 is violated and the details (Figure 5) show a maximum value of 0.31 % of the fundamental. High values of the multiple of three harmonics are very typical for low voltage grids and the measured disturbance level is very unlikely to cause Flicker problems.
Evaluation of voltage changes
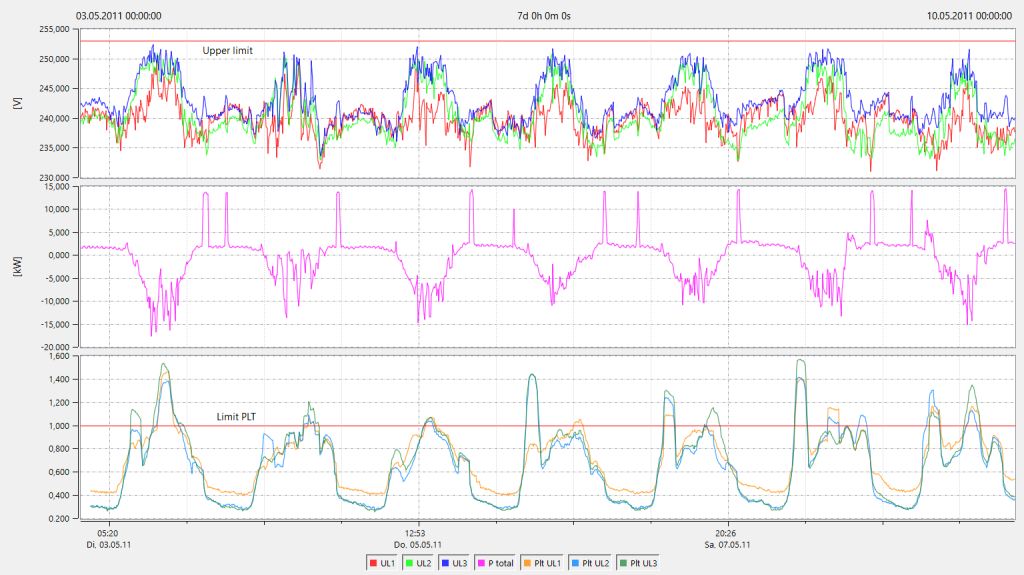
In order to evaluate the high levels of voltage change, it makes sense to have a closer look at the permanent record. Using the selection field on the left, we choose the values Ueff (effective values of voltage), PLT (long term flicker of UL1, UL2, UL3) and active power P total.
It is always helpful to visualize the power at the measuring point when analyzing changes in voltage or Flicker problems. By regarding the power values, it can be estimated whether the load is affected by phenomena in the grid or whether the load itself is the creator of disturbances.
The resulting graph shows a clear correlation between power delivery of the PV plant (about – 15 kW) and increased PLT values.
During the night, the long term Flicker Plt is about 0.3 and rises up to 1.4 as soon as the PV plant runs. This lies clearly above the norm threshold of 1. The graph is also showing the reason for the increase of the Flicker value:
Flicker strongly corresponds to changes in voltage. Every time the PV plant is pushing power into the grid, the voltage level increases by approximately 10 V, leading to a very high voltage level of more than 250 V (Figure 6). The fluctuating PV power generation produces fluctuating voltage levels in the grid, which results in flickering lights.
Conclusion
The power quality analysis using our PQ-Box detected voltage changes due to the power infeed of the PV plant as the source of the problem. The power of the PV system does not exceed the allowed value, which means that at the connection point, the grid is considered too weak to absorb the power of the PV plant.
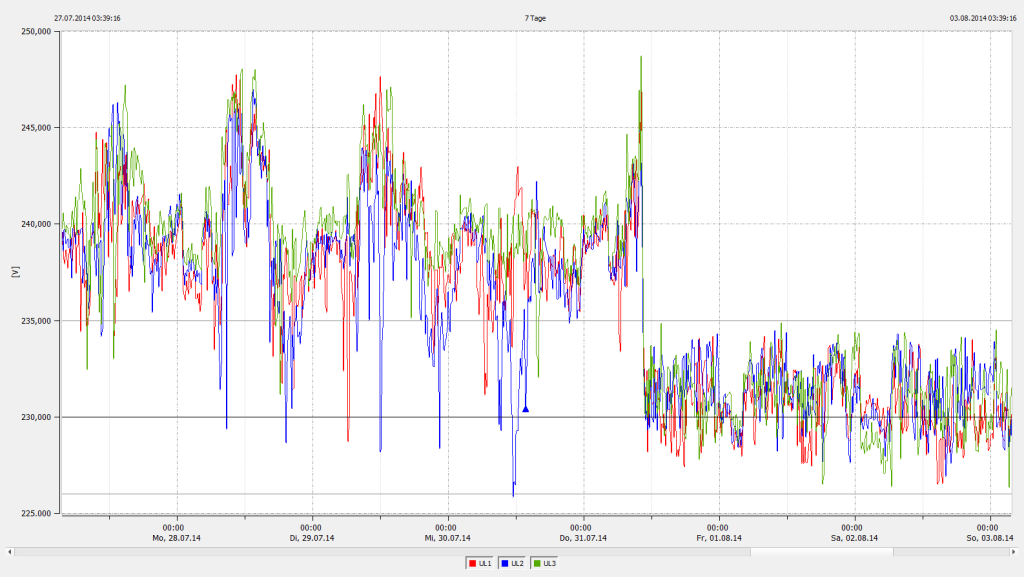
It appears that the long low voltage connection cable (650 m) to the farmer’s house had an impedance which was too high, causing a high voltage drop every time the plant was running. A possible solution for the issue would be the enhancement of the grid by installing a parallel cable or a 1 kV transmission line to the household. Due to the high cost of the grid enhancement, the energy distributor decided to install our low voltage regulation system LVRSys® at this location.
The regulation system uses a thyristor controlled inline transformer in order to regulate the voltage at the connection point of the customer. As displayed in Figure 7, the voltage stability problems could be solved using the LVRSys®.
Authors
Jürgen Blum, Product Manager Power Quality Mobile
Ronny Steinert, International Key Account Manager